Figure 7.

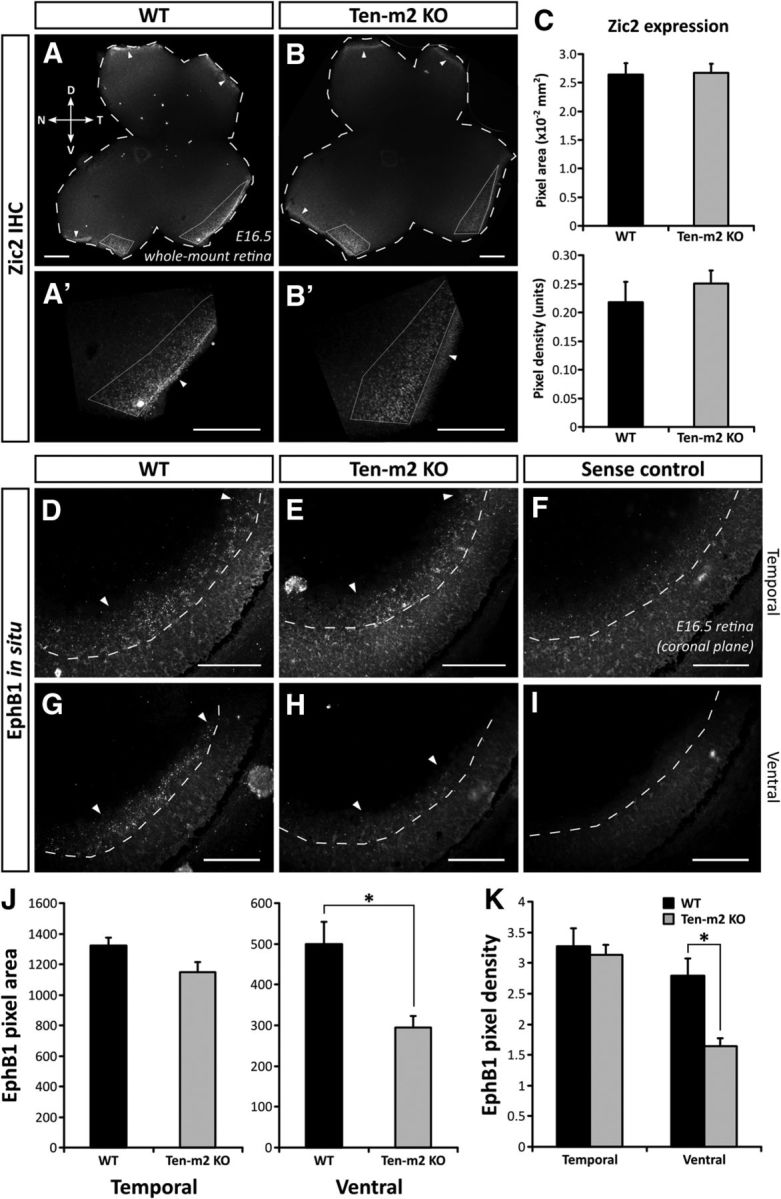
EphB1 expression is altered in the absence of changes to Zic2 expression in Ten-m2 KO retina. A, B, Immunohistochemistry against Zic2 on E16.5 whole-mount retinae (bold outline) revealed normal expression in WT and Ten-m2 KO mice, being restricted to VT retina (dotted outline) in both genotypes. Higher magnification images are shown in A′ and B′. Normal expression in the CMZ is also seen in both genotypes (arrowheads). C, Quantitative analysis yielded no differences in area or density of Zic2-positive label. D–I, In situ hybridization for EphB1 in E16.5 retinal sections revealed expression which was restricted to VT retina. In comparable coronal sections through temporal retina, no difference in EphB1 expression was found between WT (D) and Ten-m2 KO (E) mice. In contrast, EphB1 expression appeared lower in more peripheral, ventral regions in Ten-m2 KOs (H), compared with WTs (G). Sense controls are provided for WTs (F) and KOs (I), respectively. The extent of EphB1 expression within the ganglion cell layer (dashed outline) is indicated by arrowheads. A semiquantitative analysis of EphB1 expression revealed a significant difference in pixel area (J) and density (K) in ventral, but not temporal, retina of Ten-m2 KOs. *p < 0.05, Student's unpaired t test. Dorsal is to the top, temporal to the right in A–B′. Scale bars: (in A–B′) 200 μm; (in D–I) 100 μm.
