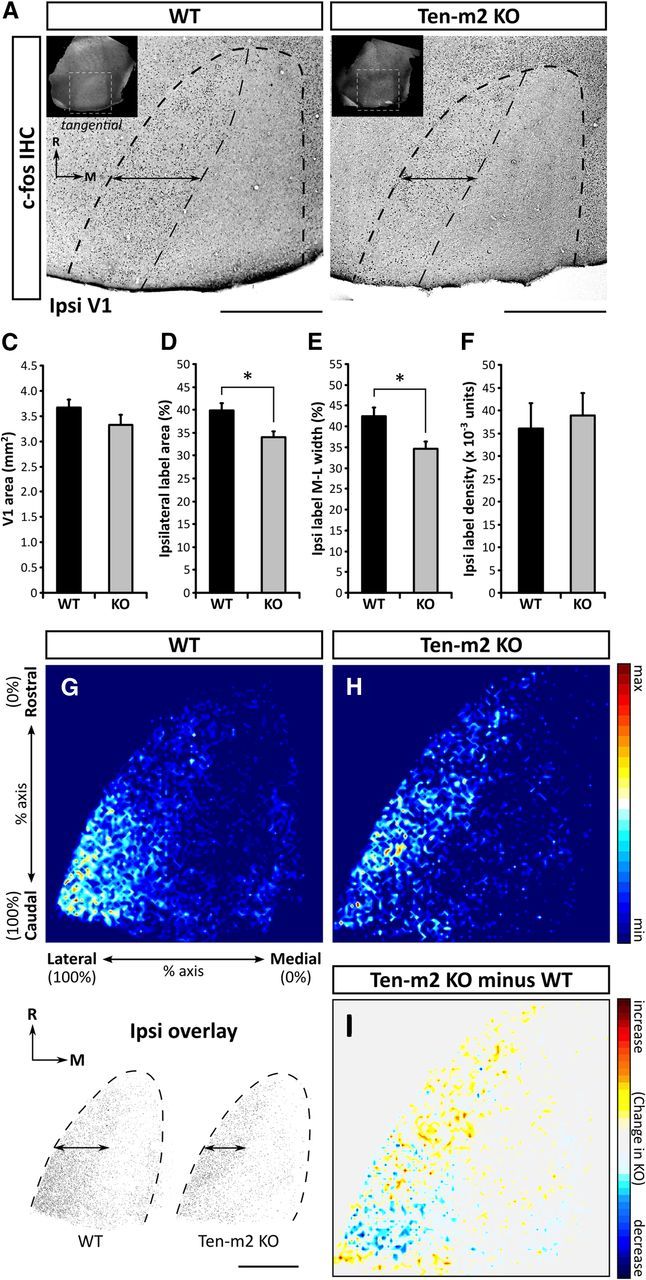
Figure 9.

Evidence for a reduction in ipsilaterally driven cortical activity in V1 of Ten-m2 KO mice. Ipsilateral to the active eye of monocularly inactivated WT (A) and Ten-m2 KO mice (B), tangential sections through layer IV of V1 (dashed outline) showed high levels of c-fos immunostaining within the lateral-most region, along the entire rostrocaudal extent. Insets in A and B indicate the location of V1 identified from transillumination images (white dashed outline). Assessment of thresholded images revealed a reduction in the area occupied by c-fos-positive cells, as well as a slight narrowing along the mediolateral axis (double arrows) of this region in Ten-m2 KOs. While no significant difference in total tangential area of V1 was found between genotypes (C), there was a significant decrease in both percentage area (D) and percentage width of ipsilateral label along the mediolateral V1 axis (E) in Ten-m2 KOs (n = 6), compared with WTs (n = 4). Furthermore, the density of ipsilateral label (F) was similar between genotypes. Images in A and B are representative tangential sections through V1 showing c-fos immunostaining. Rostral (R) is to the top and medial (M) to the right. Scale bars, 1 mm. *p < 0.05, Student's unpaired t test. G, H, Composite heatmaps were generated from overlaid thresholded images (see bottom left). Regions in red indicate greater average levels of label across all animals, while dark blue regions indicate the absence of label. A higher proportion of label in WTs was observed within caudal V1, which in addition to the narrowing of mediolateral width, was notably absent in Ten-m2 KO mice. I, Subtraction of WT signal from Ten-m2 KO signal served to highlight these differences, with blue regions showing where label is decreased in KO, with respect to WT. Signal is plotted along the percentage of the rostrocaudal and mediolateral axes of V1; color scale shown to the right.
