
Figure 3.
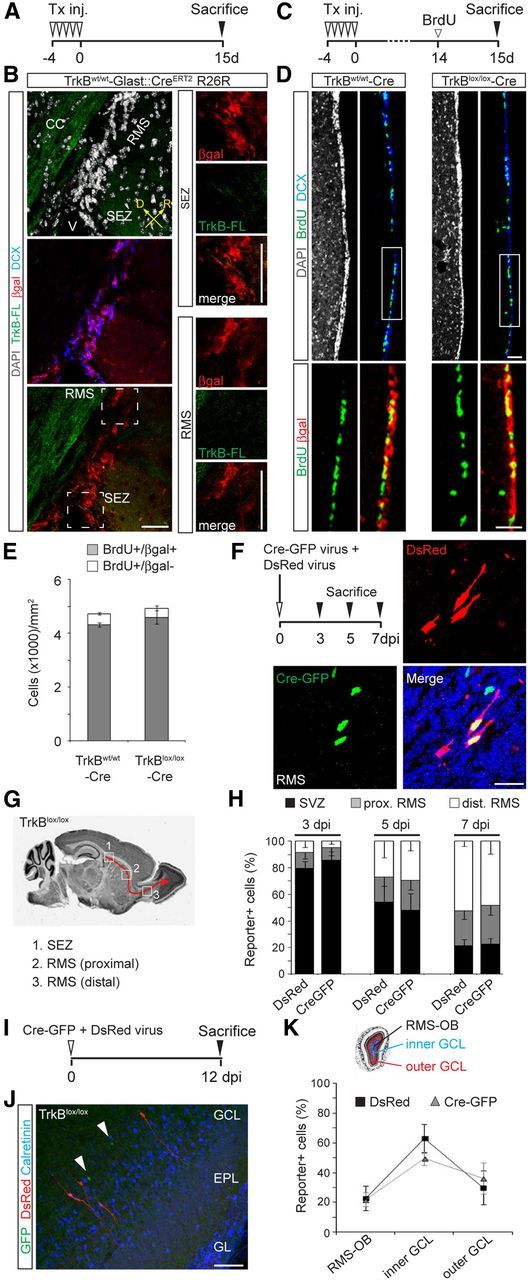
Genetic deletion of TrkB-FL does not alter proliferation of NSCs in the SEZ and migration of immature neurons to the OB. A, Experimental protocol used for Tx induction of TrkBw/w -Cre mice. B, Overview of the SEZ and initial part of the RMS showing the distribution of TrkB-FL and βgal+ cells in TrkBw/w -Cre mice 15 dptx. Note the absence of TrkB-FL immunoreactivity in the SEZ and RMS. Right panels show enlargements of the boxed areas (SEZ and RMS). Scale bar, 50 μm. C, Experimental protocol used for evaluating cell proliferation in the SEZ. Mice were treated with Tx for 5 d, killed at 15 dptx, and treated with BrdU the day before being killed. D, Confocal pictures showing the distribution of BrdU+ cells in the SEZ of Tx-treated TrkBw/w and TrkBlox/lox-Cre mice at 15 dptx. Bottom panels show magnifications corresponding to the boxed areas. Scale bar, 50 μm. E, Quantification of βgal+ and βgal− cells among BrdU+ cells in the SEZ of control and TrkB mutant mice (n = 3 mice). F, Experimental paradigm (left) used for evaluating the tangential migration of adult-born neurons. TrkBlox/lox mice were analyzed at 3, 5, and 7 dpi following coinjection of a retrovirus encoding for Cre-GFP (fusion protein) together with DsRed-encoding virus. Pictures show single- and double-transduced neurons migrating along the RMS after coinjection of Cre-GFP and DsRed retroviruses. Scale bar, 20 μm. G, Schematic illustrating the subdivision of newborn neuron's migration pathway in three different regions (1, 2, 3) used for quantifying the distribution of transduced cells in TrkBlox/lox mice following stereotactic injection into the SEZ. H, Distribution of CreGFP-expressing cells (TrkB knock-out cells) and DsRed-only-expressing cells (controls) at 3 (n = 3 mice, 470 cells), 5 (n = 3 mice, 280 cells), and 7 dpi (n = 3 mice, 752 cells). I, Experimental design used for evaluating the radial migration of newborn neurons in TrkBlox/lox mice. Mice were coinjected with Cre-GFP and DsRed retroviruses and analyzed at 12 dpi. J, Picture showing Cre-GFP transduced cells (arrowheads) and DsRed transduced cells located in the GCL at 12 dpi. Scale bar, 50 μm. K, Graph showing the distribution of transduced cells at 12 dpi within the OB. For quantification, the OB was subdivided in regions corresponding to the RMS-OB, inner and outer GCL (n = 4 mice, 843 cells). V, Ventricle; D, dorsal; R, rostral.