
Figure 3.
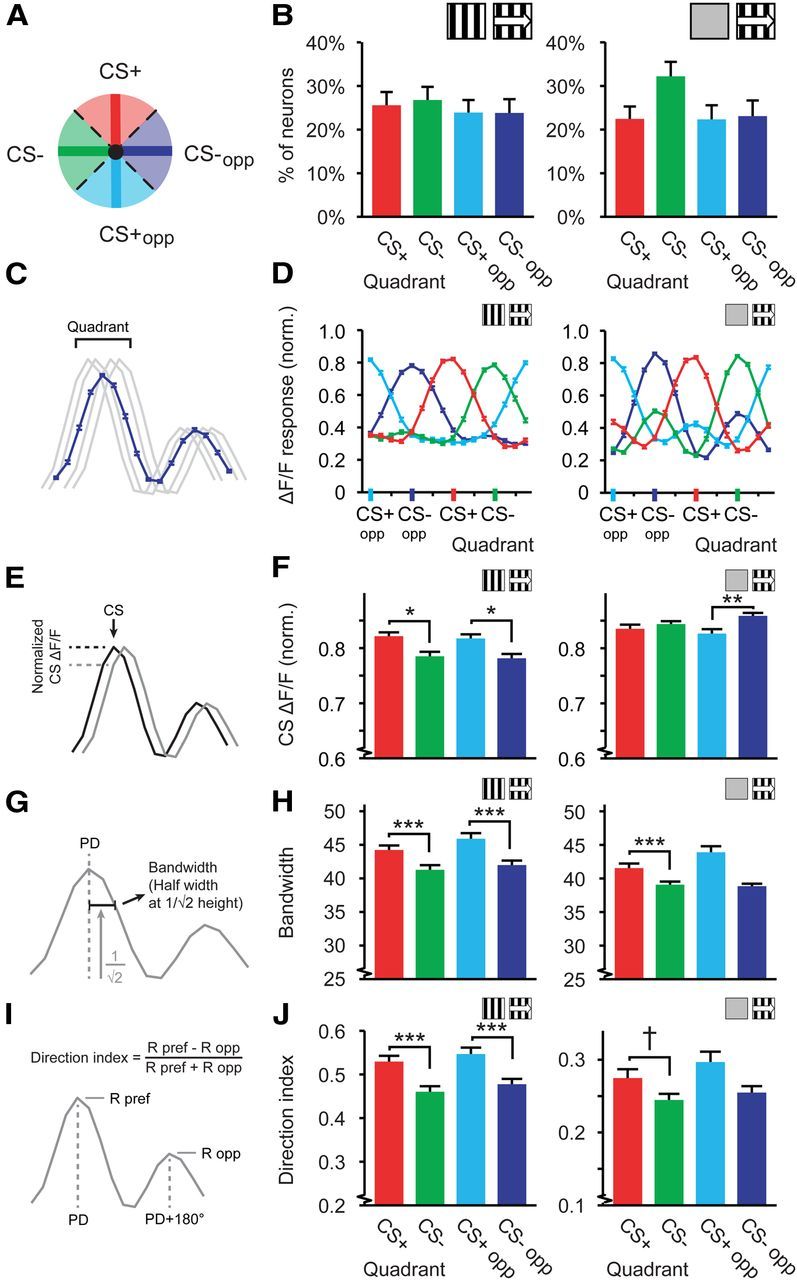
Distributions of tuning curve characteristics relative to the CS+ direction. A, Schematic representation of the quadrant division in a polar plot. B, D, F, H, J, Left, Data for tuning curves referenced against stationary gratings (Stat-ref). Right, Data referenced against gray screens (Gray-ref). B, Average percentage of cells per mouse in each quadrant, mean and SEM over mice. C, Quadrant tuning curves were constructed by averaging the tuning curves of all orientation- and direction-tuned neurons in each quadrant. D, Mean (±SEM) quadrant tuning curves (red, CS+; green, CS−; light blue, CS+opp; dark blue, CS−opp). E, The response of the quadrant tuning curve to a respective reference direction (e.g., response to the CS+ for neurons with a preferred direction in the CS+ quadrant; response to the CS− for neurons with a preferred direction in the CS− quadrant). Black and gray lines represent tuning curves of two neurons with preferred directions equal and similar to the CS+ respectively. F, The mean (±SEM) response of the quadrant tuning curve to each corresponding reference direction (Normalized on its maximum). G, Bandwidth was calculated as half-width of the tuning curve at 1/ times the maximum response in degrees. H, Mean (±SEM) bandwidth of the tuning curves in each quadrant. I, Direction index was defined as the difference between preferred and opposite direction divided by the sum. J, Idem as H, but for direction index. For all panels, data shown are for mice expressing a learning effect. Stat-ref, left panels: 14 mice; Gray-ref, right panels: 9 mice, †p = 0.059, *p < 0.05, **p < 0.01, ***p < 0.001.