Figure 5.
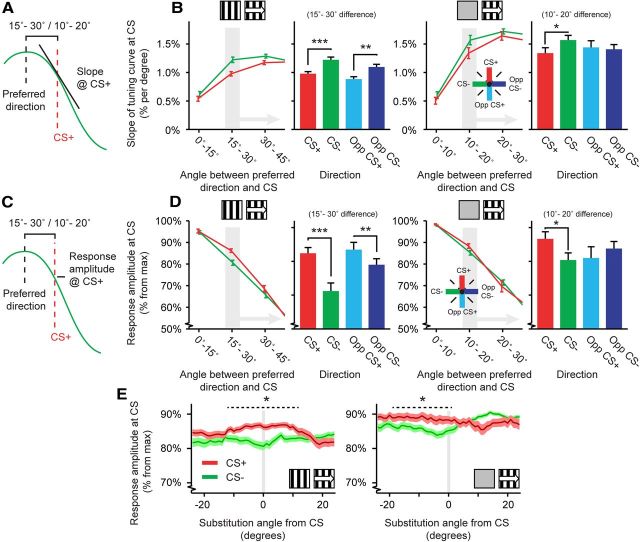
CS+ related effects on slope and response decline in trained animals that expressed learning. A, Schematic description of the measurement of tuning curve slope at the CS+ for cells with a preferred direction 15–30° (Stat-ref) or 10–20° (Gray-ref) away from the CS+ direction. B, D, E, Left, Data for tuning curves referenced against stationary gratings (Stat-ref). Right, Data referenced against gray screens (Gray-ref). B, Line plots, Mean (±SEM) slope of the fitted tuning curve at the CS+ (red) and CS− (green) directions per mouse, as a function of angular distance of the cell's preferred direction to these reference directions. Bar plots, Mean (±SEM) slope of the fitted tuning curve for the subset of neurons with a preferred direction 15–30° (or 10–20° for the Gray-ref dataset) away from the CS+, CS−, CS+opp, and CS−opp. C, Schematic description of the measurement of response amplitude at the CS+ for cells with a preferred direction 15–30° (Stat-ref) or 10–20° (Gray-ref) away from the CS+ direction. D, Same as in B, but showing the mean response amplitude of the tuning curves. E, Mean (±SEM) response amplitude of the tuning curve at the CS+ and the CS− direction after substituting these reference directions with a direction ranging between −24 to +24° in difference. For all panels: *p < 0.05, **p < 0.01, ***p < 0.001.

