Figure 6.

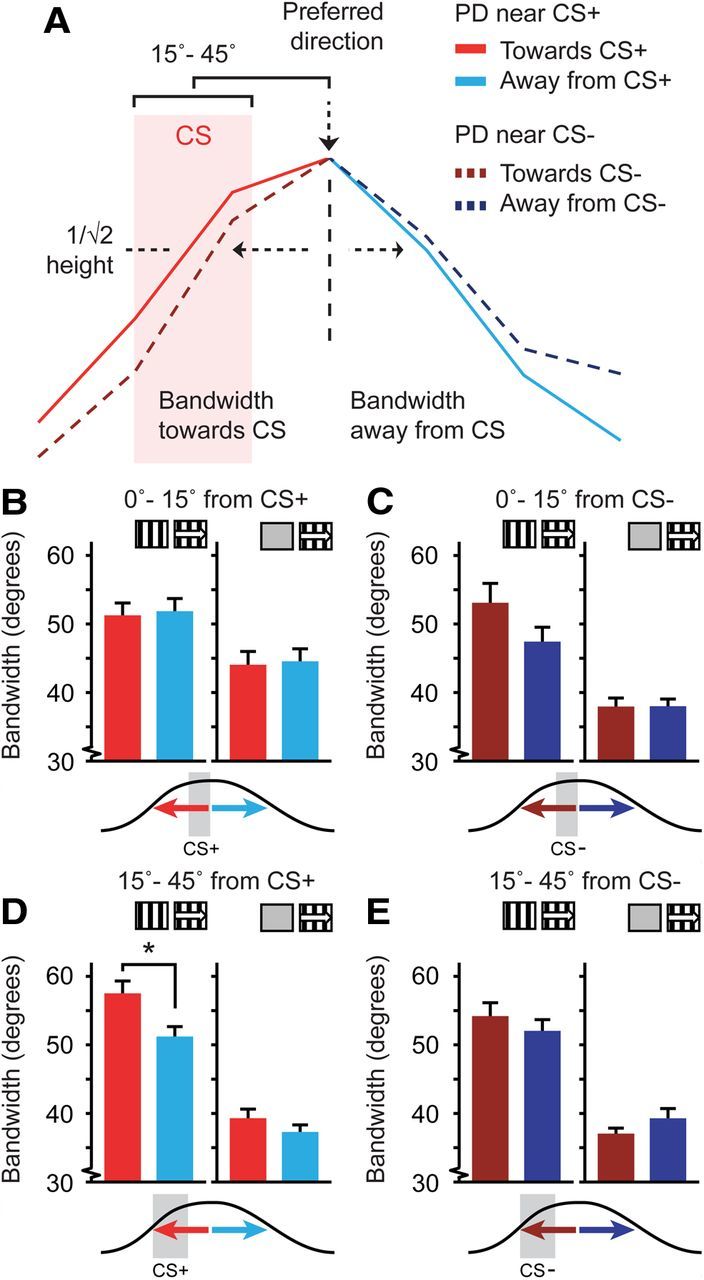
Asymmetry of the tuning curve bandwidth relative to the CS+ direction. A, Representation of two tuning curves recorded from two neurons and the quantification of bandwidth toward (red) and away (blue) from the CS+, CS−, or control directions. The bright solid red/blue tuning curve was taken from a neuron with a preferred direction differing 15–45° from the CS+ that had a broader bandwidth on the side toward the CS+. The dotted dark red/blue curve was taken from a neuron with a preferred direction differing 15–45° from the CS−. B–E, Left, Data for tuning curves referenced against stationary gratings (Stat-ref). Right, Data referenced against gray screens (Gray-ref). Red colors are for bandwidth toward the CS+, blue colors for bandwidth away from the CS+. B, Mean (±SEM) single-sided bandwidth of the tuning curve for neurons with a preferred direction that was similar to the CS+ (angular difference 0–15°). C, Same as B but for neurons having a preferred direction differing 0–15° from the CS−. D, Idem for neurons with a preferred direction differing 15–45° in angle from the CS+ (*p < 0.05). E, As in D, but for neurons having a preferred direction that differed 15–45° from the CS−.
