Figure 2.
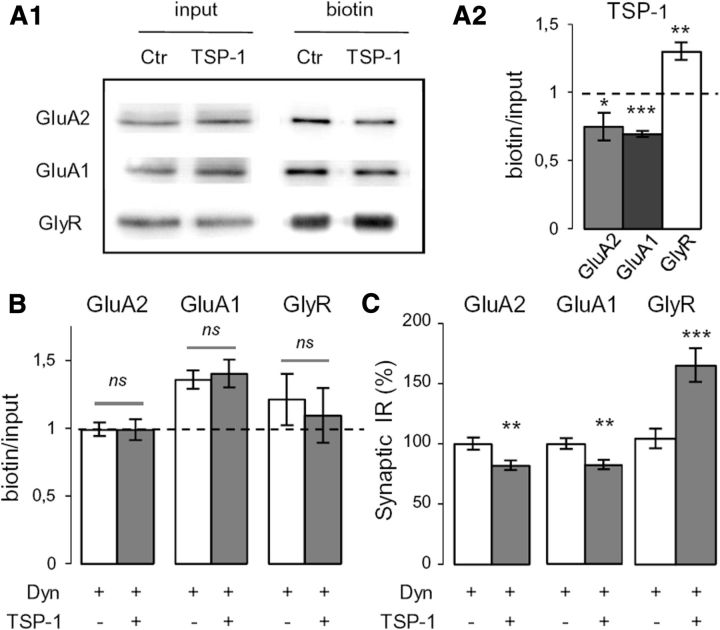
The TSP-1-induced regulations of synaptic glycine and AMPAR amounts are endocytosis-independent. A1, Representative Western blot of receptors. Neurons were treated (TSP-1, 60 min) or not (Ctr) with TSP-1 before cell-surface biotinylation (input, total amount of protein; biotin, biotinylated receptors at the cell surface). A2, Mean ratio of surface to total receptor levels in TSP-1 conditions, normalized by the control ratio (mean ± SEM; *p < 0.05, **p < 0.01, ***p < 0.001; t test). B, Normalized mean ratio of surface receptor/total receptor level in cells treated only with dynasore (white) or with dynasore and TSP-1 (gray, dynasore added 10 min before TSP-1) (mean ± SEM; ns, not significant, t test). C, Normalized fluorescence intensity associated with synaptic GluA2, GluA1, and GlyR after inhibition of endocytosis by dynasore as in B. Cells were treated or not with TSP-1 (mean ± SEM; **p < 0.01, ***p < 0.001, t test; n = 40).

