
Figure 10.
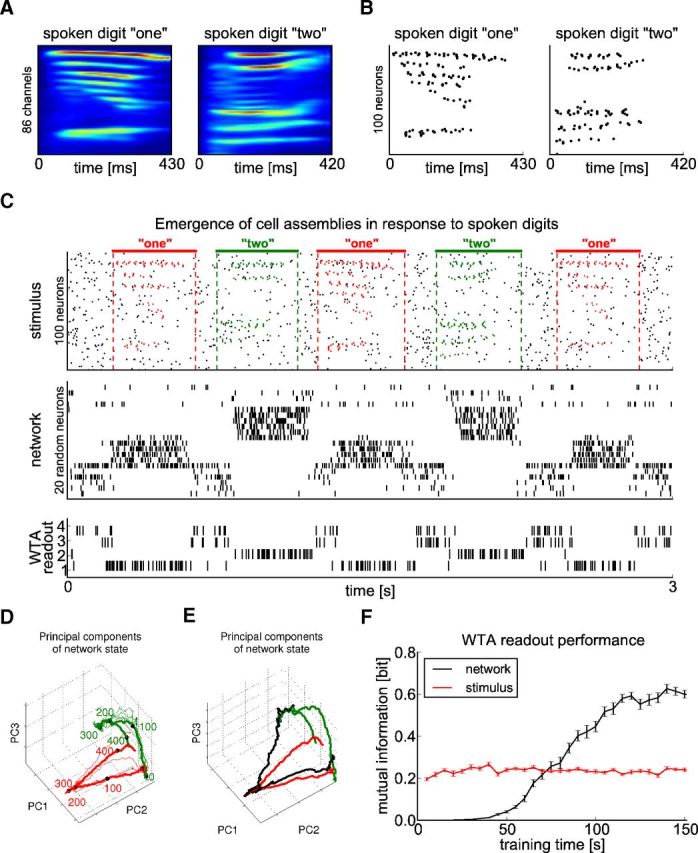
Formation of cell assemblies to different spoken digits. A, Sample cochleagrams of one specific utterance of each of the digits “one” and “two”. Each cochleagram consists of a 86-dimensional analog trace. B, Spike trains generated from the cochleagrams in A equally distributed over 100 neurons. C, From top to bottom: test stimulus, network response, output of a readout WTA circuit (learning in a completely unsupervised manner), and output of a linear readout trained by linear regression (supervised learning). The test stimulus consisted of 100 Poisson spike trains of a constant rate of 5 Hz into which utterances of digits “one” (red spikes) and “two” (green spikes) of a single speaker were embedded at random time points. These utterances had not been used for training. Resulting spike input patterns were superimposed by 2 Hz Poisson spike trains as noise (black spikes). The network response after adapting to such input stream for 100 s (∼150 presentations in total of both patterns) shows that different cell assemblies were activated during the presentation of different digits. Shown is the activity of 20 randomly selected neurons. The WTA readout consisted of four neurons, the spike trains of which are shown. Its synaptic weights resulted from STDP applied during 10 s of spoken word presentations after the assemblies in the network had emerged (without a teacher). D, 3D plot of the first three principal components of the network states during the test phase shown in C. Colors as in C (red: digit “one”, green: digit “two”; responses to intermediate noise not shown). The thick, colored lines show the average response over multiple trials; numbers show time in milliseconds after trajectory onset marked by black dots. E, Network trajectory for an error trial shown in black (red and green curves are average responses for the two different stimuli as in D). The trajectory started out in the standard way for digit “one,” but jumped later to the area of the state space typically visited for digit “two.” F, Evolution of the performance of the unsupervised WTA readout. After every 5 s of training of the recurrent network, the WTA readout was exposed for 10 s to the spike trains generated by the recurrent network. The resulting performance was measured by the mutual information between the stimulus class (digit) that the recurrent network received as input and the average firing rates of the neurons in the WTA readout during pattern presentations. Performance was averaged over 100 trials with different networks. Error bars denote SEM. After the recurrent network had received these inputs, the emergent assemblies enabled the WTA readout to achieve a better discrimination than when applied in the same manner directly on the input (stimulus) to the recurrent network (red curve in F).