Figure 8.
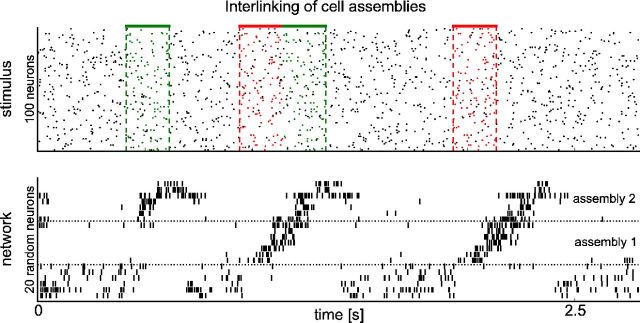
Interlinking of cell assemblies. Top: Red and green pattern (defined and superimposed by noise as in Fig. 5) had been shown in immediate succession for 100 s (∼125 presentations) in the input stream. This caused the emergence of interlinked assemblies of neurons. Whereas the network responded to the green pattern alone with assembly 2, the red pattern always triggered the whole assembly sequence (assembly 1 followed by assembly 2) regardless of whether it was followed by the green pattern or not. Bottom: Response of the network to the test input. Shown is the activity of 20 randomly selected neurons. To illustrate the sequential activation during pattern presentations, neurons are sorted according to their mean activation time during the red–green pattern sequence.

