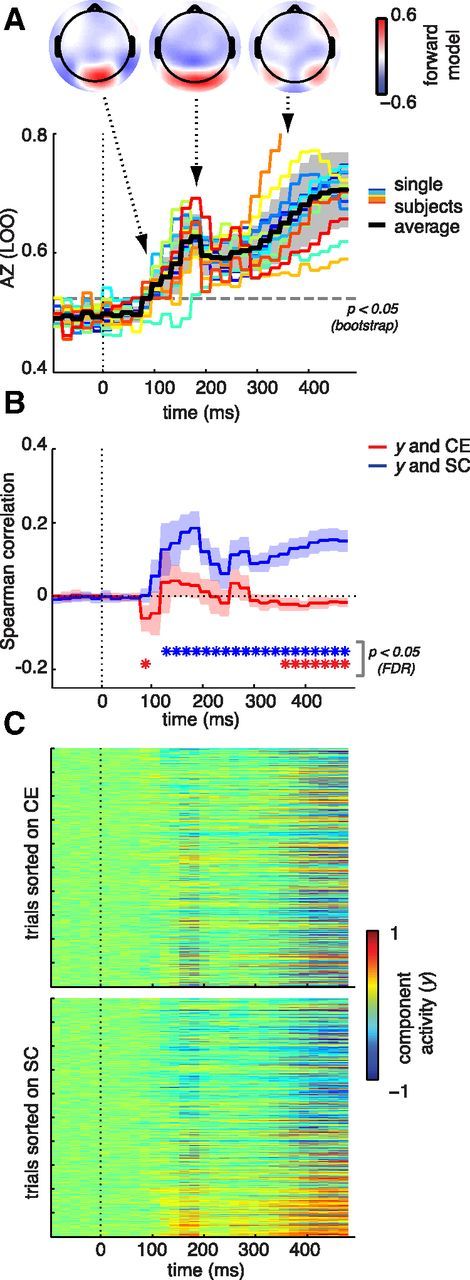
Figure 6.

Discriminant analysis results. A, Discriminator performance (AZ) determined using a leave-one-out procedure (LOO). Colored lines reflect single-subject results; the black line represents the average across subjects. Grayscale shading indicates SDs. The dashed gray line represents the Az value leading to a significance level of p = 0.05 (obtained from a bootstrap test). Insets, Scalp distributions of discriminating component activity for three moments in time: the first time window of significant discriminator performance (100–120 ms), the local maximum (180–200 ms), and the sustained effects from 250 ms onwards (distribution shown for the 320–340 ms window). B, Correlation of discriminant component value (y) with CE (red) and SC (blue). Confidence intervals and p values (FDR-corrected for the number of time points and parameters) were obtained by testing the average correlation across subjects against zero. *Time windows with significant correlations. C, Discriminating component maps displaying the value of discriminating component amplitude y for each image and time window, averaged over the two single-trial presentations and sorted on either CE (top) or SC (bottom). Higher component activity (red) indicates relatively more evidence for a “natural” response.
