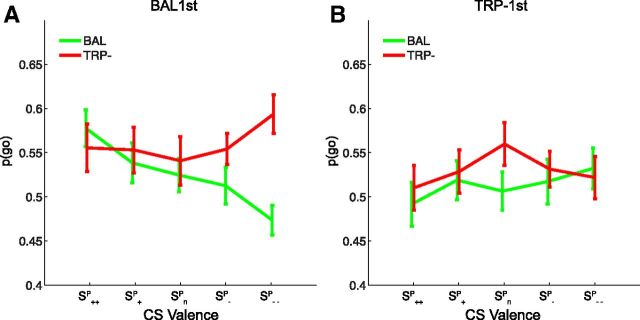
Figure 3.
Behavioral data from the PIT stage as a function of group. Shown are choice data as a function of CS Valence (SP++ / SP+ / SPn / SP−/ SP−−) after acute tryptophan depletion (TRP−, red line) and after the balanced amino acid drink (BAL, green line). A, Participants who started with BAL on day 1. B, Participants who started with TRP− on day 1. Error bars represent SEM.

