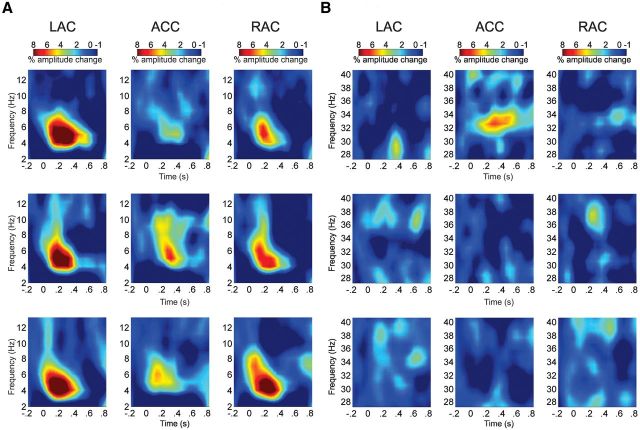
Figure 5.
A, TSE grand average plots (2–12 Hz) of the single-trial source waveforms at left auditory cortex (LAC), ACC, and right auditory cortex (RAC) sources for native deviant (first row), non-native deviant (second row), and standard (third row) stimuli. Increased percentage of amplitude change relative to baseline of mixed induced and evoked oscillatory activity is shown in the theta band. Time (from left to right) is presented in seconds (s) and frequency (from bottom to top) in hertz (Hz). B, TSE grand average plots (28–40 Hz) showing enhancement of oscillatory activity at the ACC source in the low gamma band (30–34 Hz) exclusively for native deviant.

