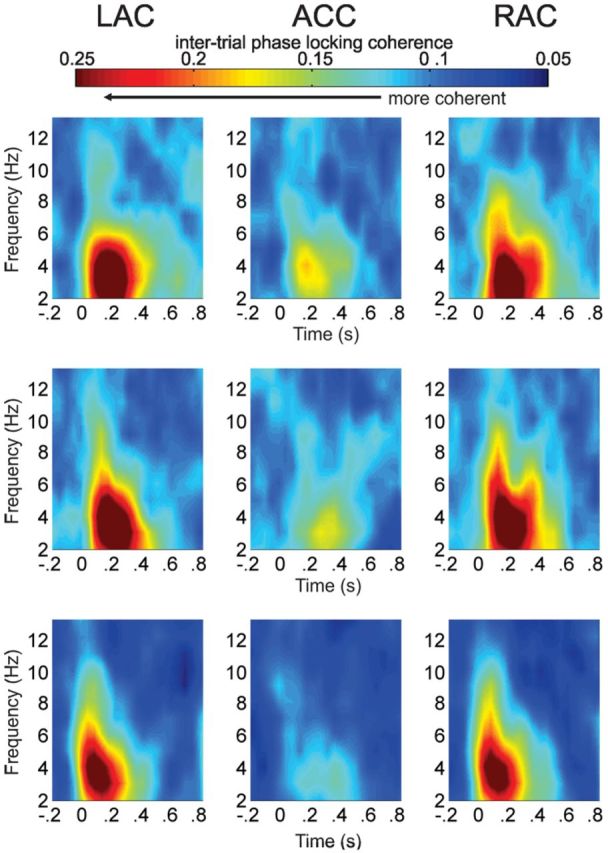
Figure 6.

ITPL grand average plots (2–12 Hz) at left auditory cortex (LAC), ACC, and right auditory cortex (RAC) sources for native deviant (first row), non-native deviant (second row), and standard (third row) stimuli. Increased phase locking across trials, a reflection of intertrial coherence, is shown in the delta/theta band (2–4 Hz) predominantly in auditory sources with small activity in the ACC. Frequency is given in hertz (Hz) and time in seconds (s).
