
Figure 9.
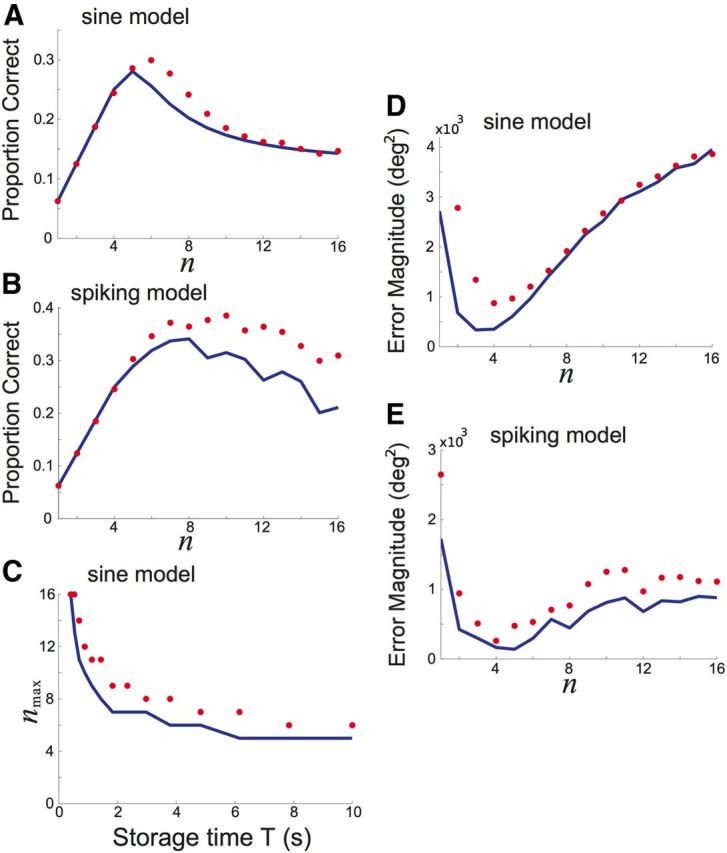
The proportion of correct responses depends on the number of possible outputs, n. Blue curves are computed using theoretical probability densities and red dots employ numerically computed probability densities (see Materials and Methods). A, Proportion p(Z = X) of correct responses Z varies with n in the sine model for delay (storage) time T = 10 s. B, Proportion of correct responses p(Z = X) as a function of n in the spiking model for delay (storage) time T = 10 s and input number m = 16. C, The number of outputs nmax that maximizes the proportion of correct responses as the storage time T is varied in the sine model. D, Error magnitude (in degrees squared) varies with n in the sine model for delay (storage) time T = 10 s. E, Error magnitude (in degrees squared) varies with n in spiking model for delay (storage) time T = 10. Input number m = 16. In the sine model, well height h = 1 and noise variance σ2 = 0.16.