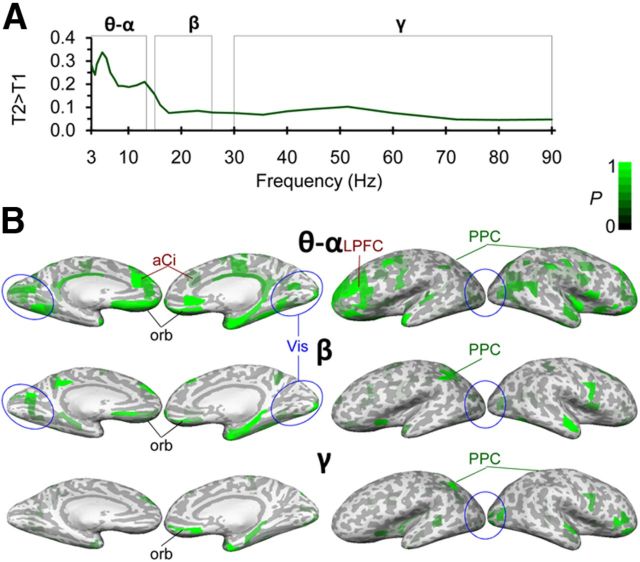
Figure 6.
Oscillation amplitudes are greater in T2 than in T1 in all frequency bands. A, T2 was associated with stronger oscillation amplitudes than T1 (task effect of the two-way ANOVA for task × load p < 0.01, FDR-corrected). B, The stronger amplitudes in T2 originated from distributed visual regions mainly in temporal cortices as well as from distributed regions in LPFC.

