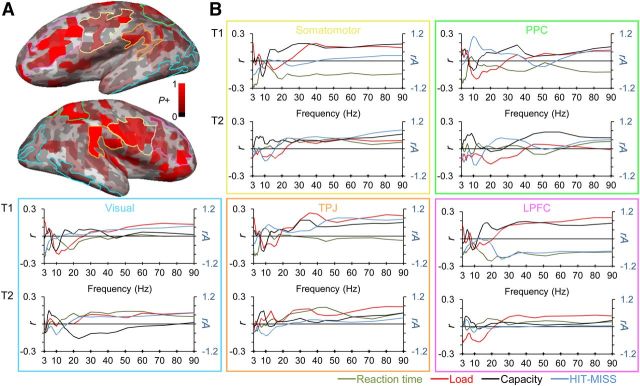
Figure 7.
Summary of the main results reveals that oscillation amplitudes are differentially modulated by task demands in early and late regions of visual processing hierarchy. A, Total fraction of positive significance in load and capacity conditions (Figs. 3 and 5) shown in inflated cortical surface. Pink, yellow, green, orange, and blue lines indicate LPFC, somatomotor (SM), PPC, TPJ, and visual ROIs, respectively. B, Pearson correlation coefficients (r) for the correlation of oscillation amplitudes with load, capacity, and decreasing reaction time (red, black, and green lines). Blue lines denote the difference of relative oscillation amplitudes (rA) between detected and undetected trials.

