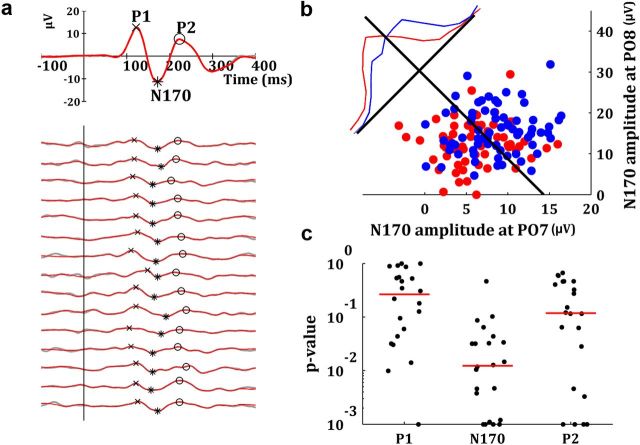
Figure 3.
Decoding of the conscious reports with the single-trial N170. a, Average ERP and 15 denoised single-trial ERPs at electrode PO8 for a typical subject. The identification of the single-trial peaks is shown with the markers. b, Distribution of single-trial N170 responses in a typical participant used for decoding. Each blue (red) dot represents the single-trial N170 amplitudes measured at electrodes PO7 and PO8 in a seen (unseen) trial. The black line represents the Fisher's linear discriminant. The blue and red lines show the normalized distributions for seen and unseen trials projected along the axis perpendicular to the linear discriminant. c, Black dots show in a logarithmic scale the individual p values of the decoding performance with different components. The red lines indicate the median of the distribution of p values for each component.

