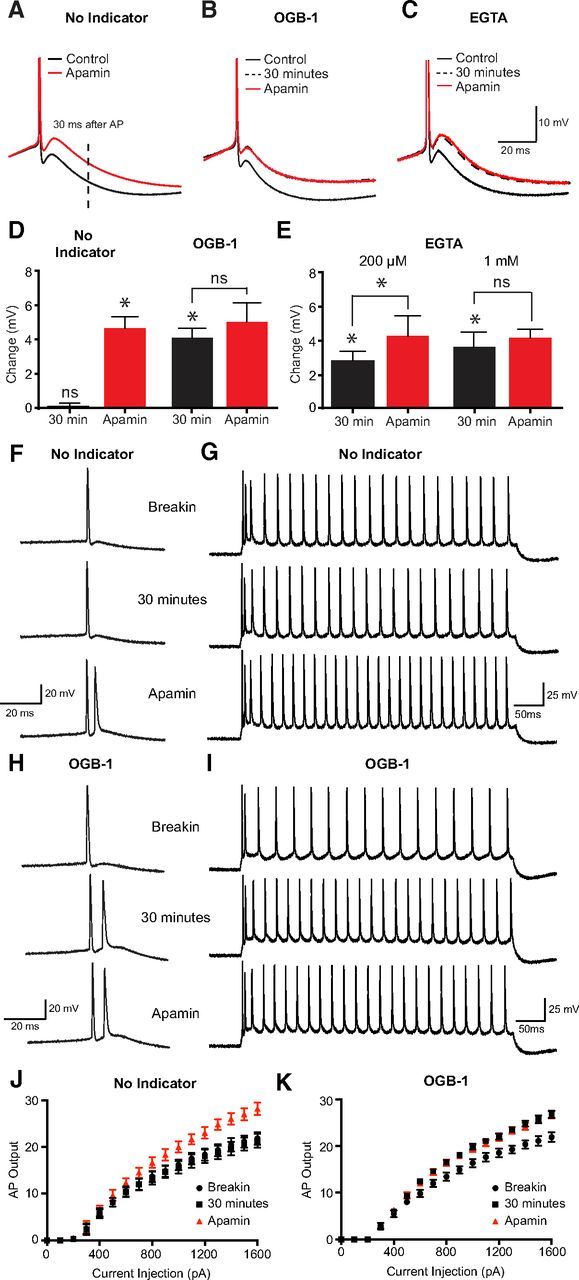
Figure 5.

Impact of calcium chelators on the mAHP and action potential firing. A–C, Truncated somatic action potentials evoked by 200 ms somatic current pulses showing the mAHP in control just after initiation of recording (black, solid line), 30 min after recording (black, dashed line) and in the presence of apamin (red, solid line). Recordings were made with no internal calcium indicator in the pipette solution (A), and with OGB-1 (B; 200 μm) or EGTA (C; 1 mm) in the pipette solution. mAHP amplitude was measured 30 ms after AP onset (dashed vertical line in A). D, E, Average change in mAHP amplitude in the absence (black) and presence (red) of apamin in cells with and without OGB-1 in the pipette solution (D) and in cells dialyzed with 200 μm or 1 mm EGTA (E). F, G, Action potential firing in response to a 200 ms current step just above rheobase (F) or in response to a 500 ms current step (G, 1600 pA amplitude) just after break-in (top), after 30 min (middle), and in apamin (bottom) in control. H, I, Action potential firing in response to a 200 ms current step just above rheobase (H) or in response to a 500 ms current step (I, 1600 pA amplitude) just after break-in (top), after 30 min (middle), and in apamin (bottom) in cells dialyzed with 200 μm OGB-1. J, K, Input–output properties during 500 ms somatic current injections in control (J) and in cells dialyzed with 200 μm OGB-1 (K) immediately after break-in (black circles), after 30 min (black squares), and after the addition of apamin (red triangles). *p < 0.05. ns, Not significant.
