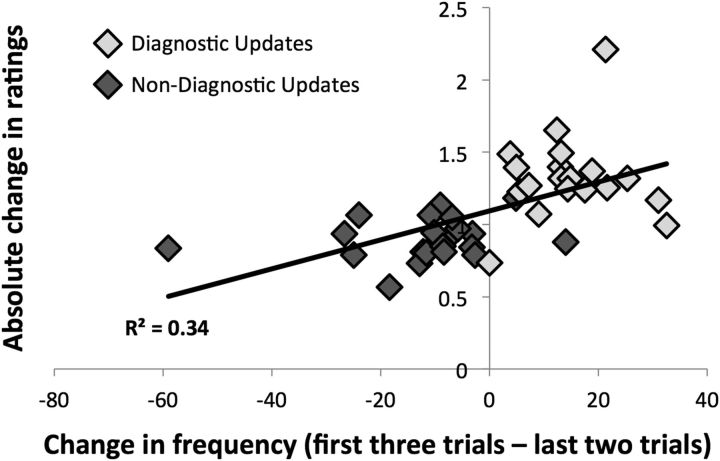
Figure 4.
Correlation between update magnitude and changes in perceived frequency. Larger update magnitudes (i.e., absolute changes in relevant ratings) were positively associated with larger changes in the perceived frequency of behaviors (collected externally). As behaviors were grouped in a predetermined fashion, each marker represents one individual, comprising five specific behaviors. Positive values on the x-axis denote individuals for whom the first three behaviors were perceived as more frequent, on average, than the last two. Negative values denote individuals for whom the first three behaviors were perceived as less frequent, on average, than the last two. Dark gray markers represent individuals containing nondiagnostic updates (i.e., a shift from immoral to moral or competent to incompetent behaviors), while light gray markers represent individuals containing diagnostic updates (i.e., a shift from moral to immoral or incompetent to competent behaviors).

