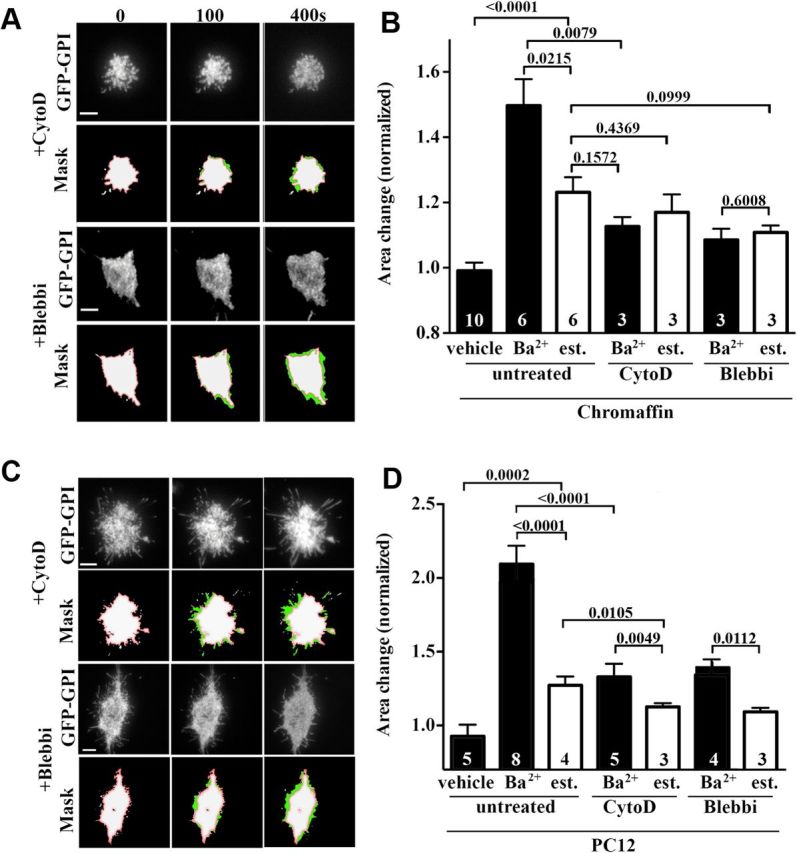
Figure 4.

Interfering with actin polymerization and myosin II function reduces footprint enlargement. Bovine chromaffin (A, B) and PC12 (C, D) cells coexpressing GFP-GPI and NPY-mCherry were treated with cytochalasin D (CytoD) or blebbistatin (Blebbi) for 20 min before examination by time-lapse TIRF microscopy. Cells were then stimulated with Ba2+ and imaged at 2 Hz. A, B, Time-lapse profile of the GFP-GPI fluorescence in the footprint of chromaffin (A) or PC12 (B) cells treated as indicated. Bottom, GPI-GFP footprint area (green) with an overlay of the prestimulation area (white with red outline). Scale bars, 5 μm. B, D, Footprint area change under indicated conditions 400 s after Ba2+ stimulation or vehicle treatment for chromaffin (B) and PC12 cells (D) based on either the actual GFP-GPI measurements (black bars) or the corresponding estimated (est.) footprint increase based on fusion events (white bars). Note that for both blebbistatin and cytochalasin D treatments in chromaffin cells, the measured and estimated footprint area changes do not differ significantly. The numbers inside the bars indicate the numbers of cultures analyzed.
