
Figure 2.
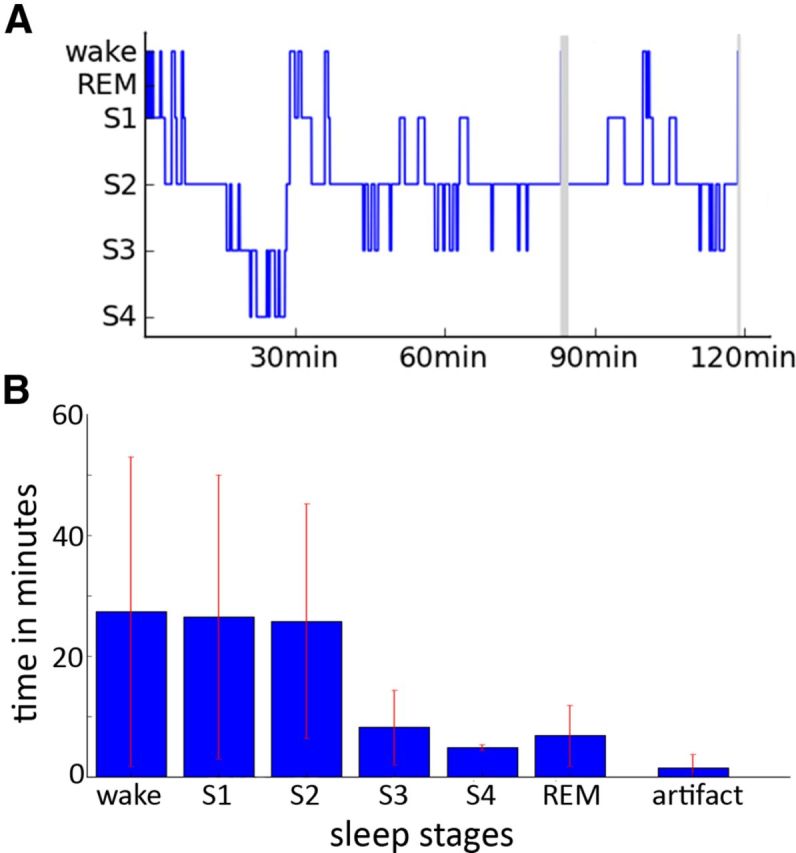
Sleep staging and sleep duration. A, Example of a hypnogram for one participant. Gray areas indicate phases in which sleep staging was not possible due to scanner artifacts. B, Average time spent in waking state and different sleep stages across participants. Note that for S3 and S4 only five and for rapid eye movement sleep (REM) only four participants were taken into the average as the others did not reach those stages.