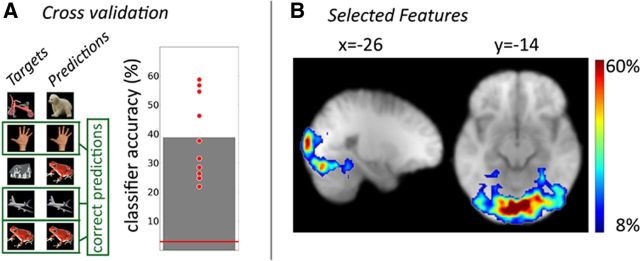
Figure 4.
Extraction of stimulus-specific representations by multivariate pattern analysis. A, Pattern classification accuracy as assessed by a cross-validation approach. Each red point indicates results from one participant. The red line indicates chance performance (3.125%). B, The classifier was trained on the 1000 most discriminative features (i.e., voxels) from each subject. The figure shows the regional distribution of features that were selected most often, which were most abundant in the occipital lobe but reached into inferior temporal cortex.

