Figure 2.

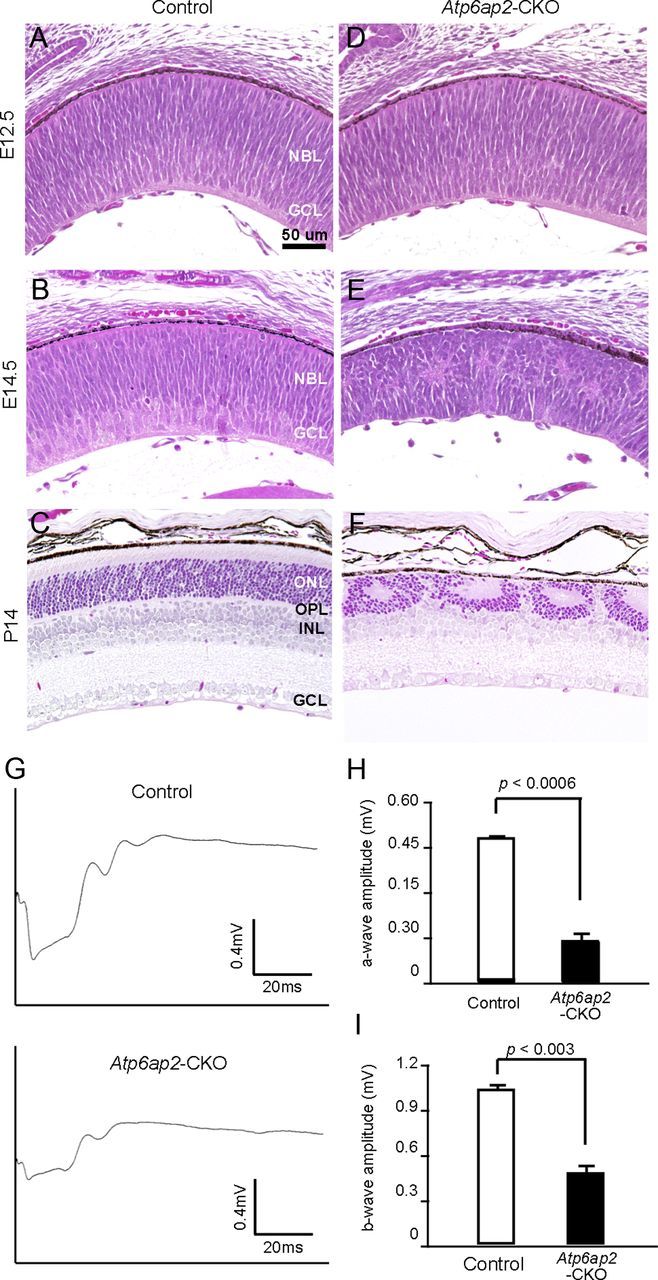
Retinal structure and function were damaged in Atp6ap2-CKO mice. A–F, H&E staining of control and Atp6ap2-CKO retinas at E12.5, 14.5, and P14. NBL, Neuroblastic layer; ONL, outer nuclear layer; OPL, outer plexiform layer; INL, inner nuclear layer; GCL, ganglion cell layer. Scale bar, 50 μm. G–I, Full-field ERG. Representative wave responses from 4-week-old control and CKO mice (G). Significant difference was observed in the a-wave amplitude (H) and b-wave amplitude (I) between control and Atp6ap2-CKO mice. Control mice, n = 6; Atp6ap2-CKO mice, n = 7.
