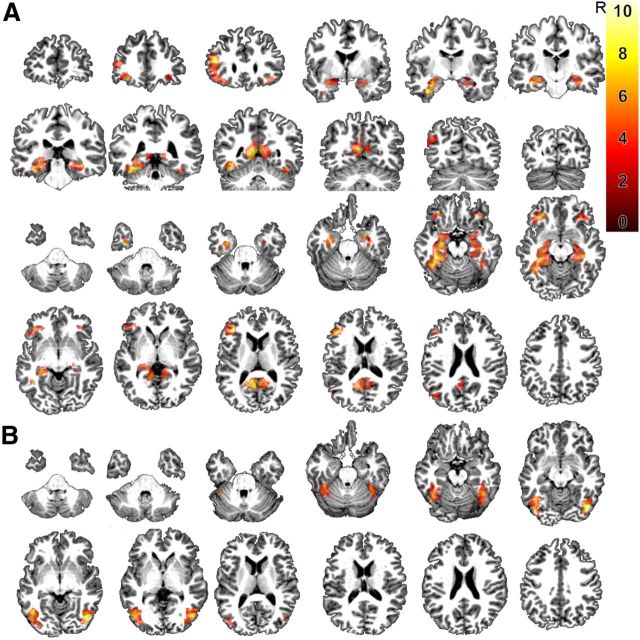
Figure 3.
A, Coronal and axial slices depicting the main effect of task (feature verification task for words and pictures vs control task for words and pictures) at a voxel-level inference threshold of uncorrected p < 0.001 combined with a cluster-level inference of p < 0.05 (Poline et al. (1997)). B, Axial slices showing the interaction effect of task and modality at the aforementioned threshold. The color scale indicates the T values of the contrasts.

