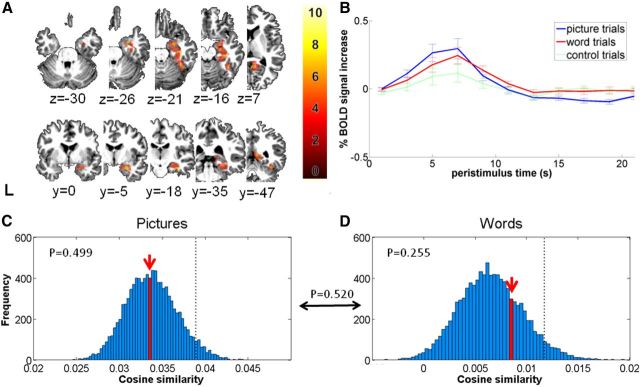
Figure 5.
Semantic clustering effects in right occipitotemporal VOI. A, Transverse and coronal slices depicting the VOI as an overlay. The color scale indicates the T values of the contrasts. B, Plots of the peristimulus response function show the percentage signal change after stimulus onset elicited by feature verification trials using word or picture presentations of the animal stimuli. Error bars indicate 1 SEM across subjects. C, D, Probability distributions for the effect of semantic cluster. The red arrow indicates the ACS of the right occipitotemporal activity patterns between entities belonging to a same cluster, presented as (C) pictures or (D) words. x-axis: cosine similarity averaged over the group of subjects. y-axis: absolute frequency of a given average cosine similarity value across a total of 10,000 random permutation labelings. Dotted line: 95th percentile of the distribution. The p value in between the word histogram and the picture histogram is the result of the Wilcoxon rank sign test comparing the rank of words versus the rank of pictures within their respective distributions.

