Figure 6.
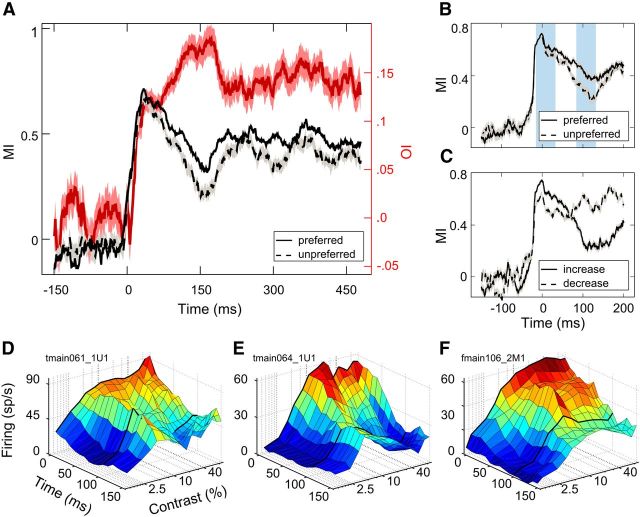
Changes in non-monotonicity over time. A, Average MI as a function of time, time locked to stimulus onset. MI, calculated in 20 ms time windows, shifted by 1 ms and averaged across the population, is plotted as a function of time for both the preferred (solid line) and unpreferred (dotted line) orientation. The population average OI (see Materials and Methods, Analysis of temporal dynamics) as a function of time is reported in red. Note that critical patterns for the two indices are coincident in time. B, Average MI over time, time locked to response onset (conventions as in A). The light blue shaded areas represent the two 50 ms time windows of maximal interest. C, Average MI over time for cells showing increasing or decreasing monotonicity. MI over time is reported separately for the subpopulation of cells with decreasing monotonicity (n = 209, solid line) and the subpopulation of cells with increasing monotonicity (n = 95, dotted line) as calculated from the comparison between the time windows of maximal interest. D–F, Single-cell examples. Average firing rate [spikes per second (sp/s)] of three representative neurons plotted as a function of contrast and time for 16 overlapping time epochs (50 ms width, 10 ms shift); surface color turns from blue to red for progressively higher discharge rate. Note that, with reference to C, single examples in D and E belong to the subpopulation of cells showing increasing non-monotonicity over time, whereas the example in F belongs to the subpopulation of cells with modestly decreasing non-monotonicity over time.

