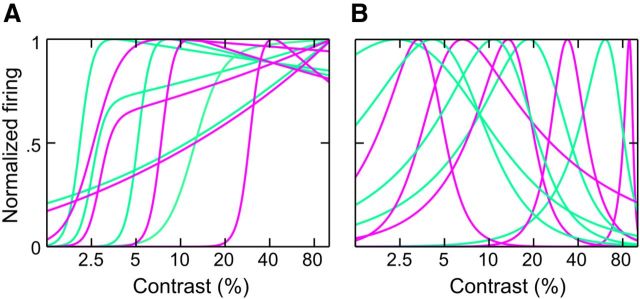
Figure 8.
Filtering properties in late epochs. Normalized responses (i.e., response − baseline, divided by the maximal response) of example neurons in the late time window (100–150 ms). A shows a set of 10 neurons showing a monotonic CRF, as described by the Peirce equation (s ≤ 1.1); note that most of the functions saturate or show some degree of supersaturation. B shows a set of 10 neurons characterized by a selective CRF, as described by the Peirce equation (s > 1.1); note that different neurons are selective for different contrast levels. For the sake of clarity, response functions are drawn in alternating colors along the contrast axis.

