Figure 3.

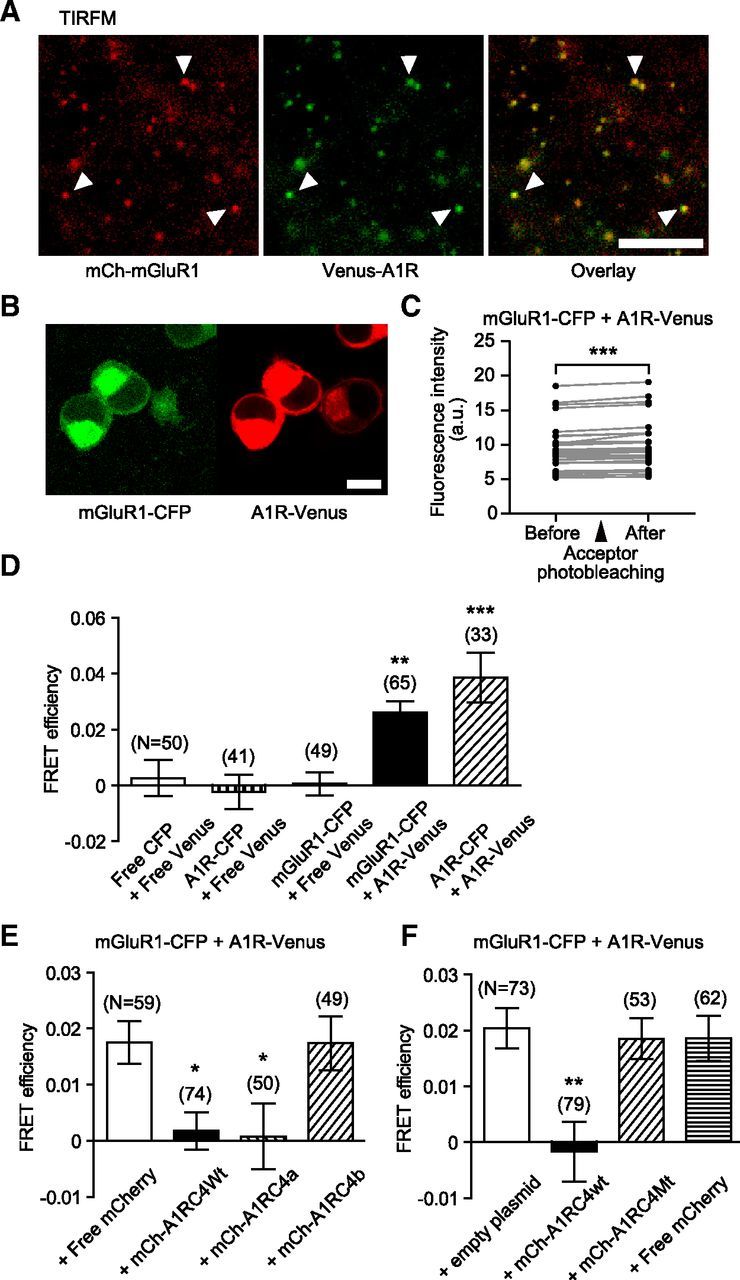
Physical interaction of A1R and mGluR1 in living cells. A, TIRF microscopic images of Neuro2a cells transiently expressing mCherry-fused mGluR1 (mCh-mGluR1, red) and Venus-fused A1R (Venus-A1R, green). Arrowheads, colocalized mCh-mGluR1 and Venus-A1R, respectively. Scale bars, 10 μm. B, Confocal laser microscopic images of Neuro2a cells transiently expressing full-length mGluR1 with the C-terminal CFP-tag (mGluR1-CFP, green) and full-length A1R with the C-terminal Venus-tag (A1R-Venus, red). Scale bars, 10 μm. C, Intensities of mGluR1-CFP fluorescence before and after photobleaching of A1R-Venus. CFP was excited at 458 nm and its emission detected around 480 nm. ***p < 0.001, paired t test. D, FRET efficiency between CFP and Venus in living Neuro2a cells. FRET efficiency was evaluated by acceptor photobleaching. A1R homodimer and mGluR1-CFP + A1R-Venus pair displayed significant FRET signals. Free CFP + free Venus pair, A1R-CFP + free Venus pair, and mGluR1-CFP + free Venus pair did not show a significant FRET signal. E, F, Reduction of FRET efficiency between mGluR1-CFP and A1R-Venus by A1R C-terminal tail. FRET efficiency between mGluR1-CFP and A1R-Venus in living Neuro2a cells was reduced by the coexpression of mCh-A1RC4Wt or mCh-A1RC4a, but not by free mCherry, mCh-A1RC4b, or A1RC4Mt. The overall difference was analyzed using ANOVA and then differences among every pair of the data groups were analyzed using Tukey-Kramer multiple-comparisons test. *p < 0.05; **p < 0.01; ***p < 0.001. Error bars, ±SEM.
