
Figure 5.
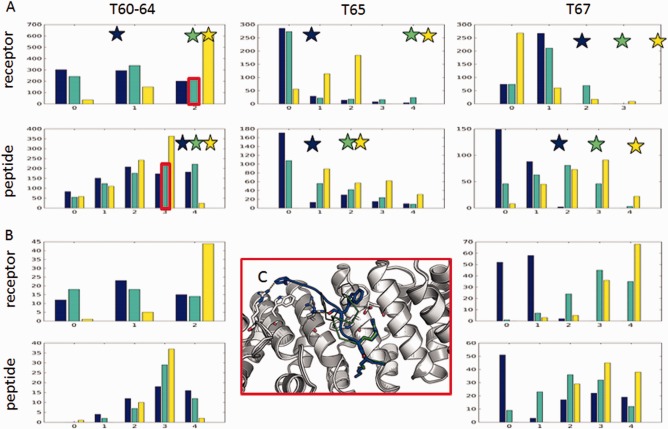
Even incorrect models can identify critical interface receptor and peptide hotspots. (A) Distribution of number of hotspots identified by incorrect models. Number of models for which Robetta (blue), FoldX2.5.2 (cyan) or mCSM (yellow) were able to identify a given number of receptor (upper) or peptide (lower row) binding residues for T60‐64 (left), T65 (center) and T67 (right). Stars indicate performance of the corresponding crystal structures. Performance based on crystal structures is highlighted as stars of the same respective color of the protocol. (B) Distribution for acceptable and medium accuracy models. (C) Example model with high hotspot recovery but poor modeling quality (T62_P36.M04; taken from the boxes outlined in red): While previously known hotspots KP1’RP2’ are correctly positioned (green and blue overlay), the rest of the peptide extends to form non‐native interactions using FP4’, which nevertheless still results in high hotspot recovery rate. [Color figure can be viewed at wileyonlinelibrary.com]