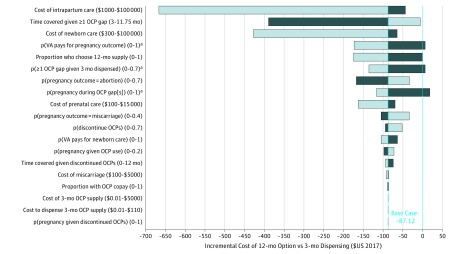
Figure 2. One-way Sensitivity Analyses.
Bar colors denote the directionality of the variable range associated with the resultant incremental cost (ie, dark blue bars represent decreasing and light blue bars indicate increasing values). Threshold values are reported in Table 2. OCP indicates oral contraceptive pill; p, probability; VA, Veterans Affairs.
aVariation can result in the 3-month strategy being favored over the 12-month option.

