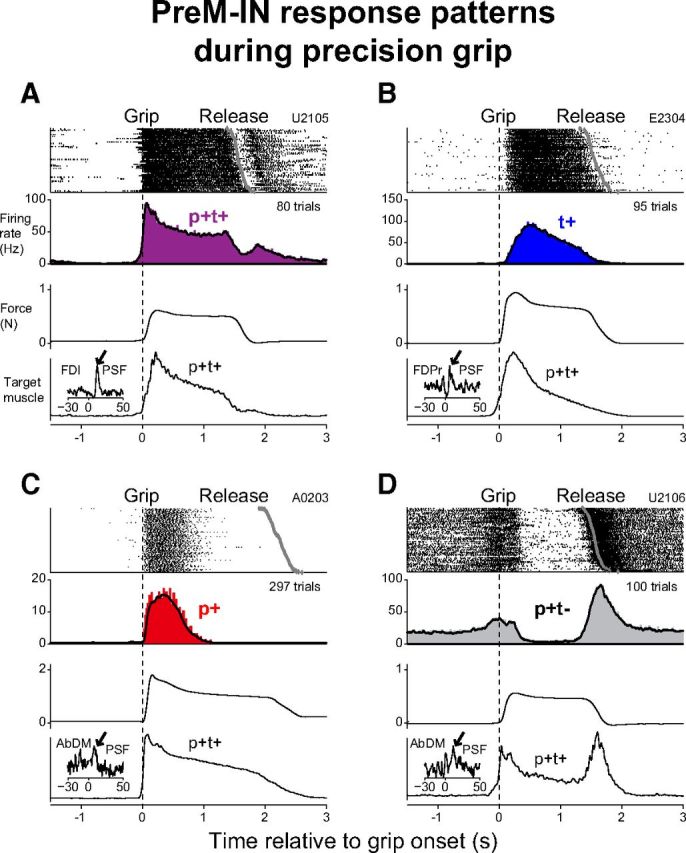
Figure 2.

A–D, Examples of four PreM-IN response patterns. In each panel, cell discharge raster plot, histogram of cell discharge (filled rectangles) and averaged instantaneous firing rates (solid line), averaged grip force, and averaged EMG of a target muscle are shown (from top to bottom). Signals were aligned to the grip onset (dotted line). The gray diamonds in the raster plot indicate the timing of release onset. One target muscle is shown for each PreM-IN. Insets indicate the STAs of the corresponding target muscle EMG and significant PSFs are indicated by the arrows. Neurons in A and D were recorded in monkey U, those in B recorded in monkey E, and those in C recorded in monkey A.
