Figure 5.

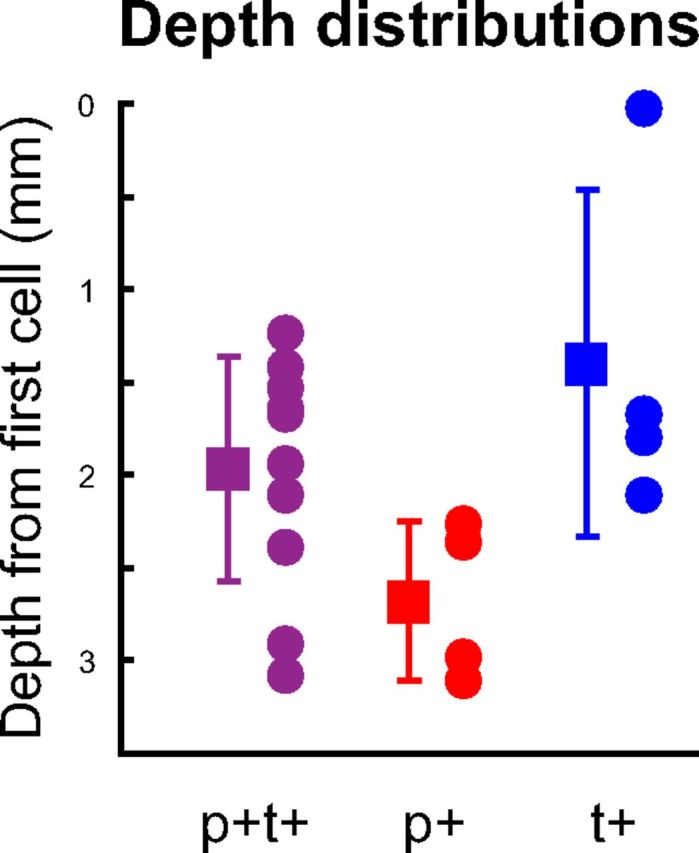
Distribution of the PreM-IN intraspinal depth relative to the first cell, shown separately for PreM-INs with p+t+ (purple), pure p+ (red), and pure t+ (blue) response patterns. Squares and error bars indicate the mean ± SD.

Distribution of the PreM-IN intraspinal depth relative to the first cell, shown separately for PreM-INs with p+t+ (purple), pure p+ (red), and pure t+ (blue) response patterns. Squares and error bars indicate the mean ± SD.