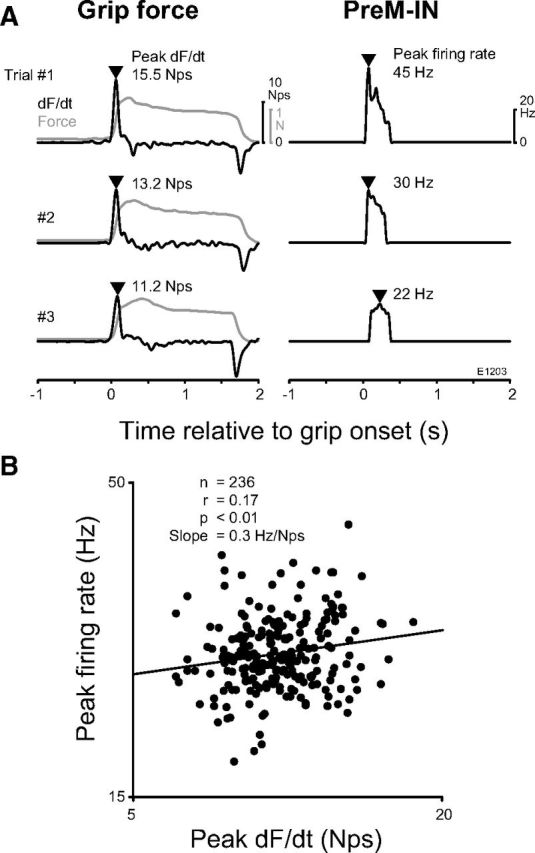
Figure 7.

Example of the correlation between the peak firing rate and the peak dF/dt. A, Three example trials showing the dF/dt (left, solid line), the grip force (left, gray line), and instantaneous firing rate of a PreM-IN (right). The triangles indicate the peak timings of the dF/dt and the PreM-IN firing rate. B, Scatter plot of the peak firing rate versus the peak dF/dt. The solid line indicates the regression line.
