Figure 3.
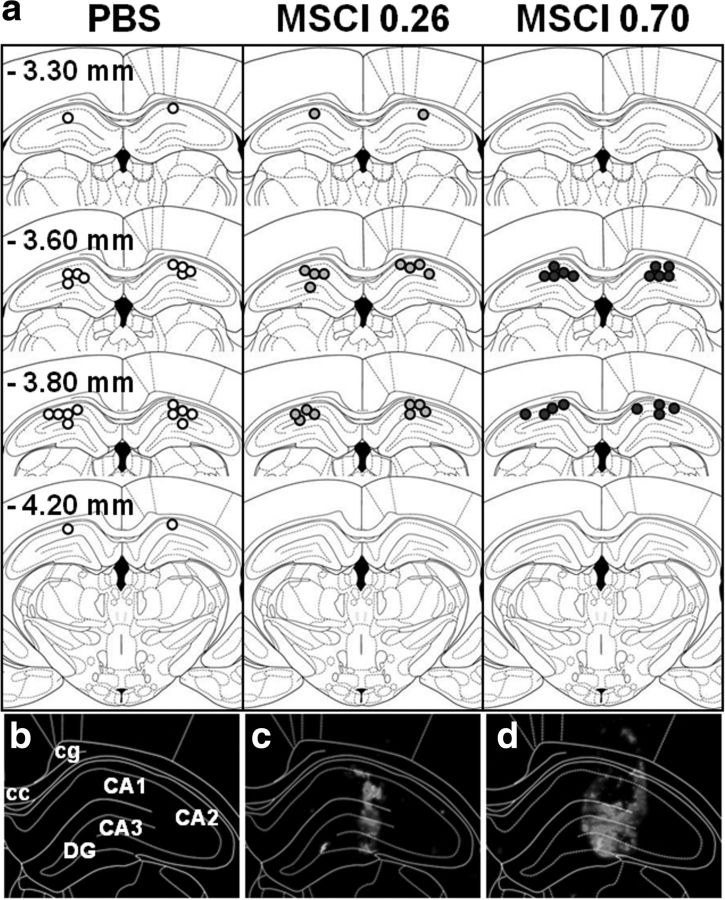
Infusion sites on coronal sections through the dHip. a, Location of the infusion sites in rats subjected to PBS (white circles) or MSCI (gray and black circles, corresponding to 0.26 and 0.70 nmol of MSCI, respectively) infusions before the probe trials. Coordinates are given in millimeters from bregma according to Paxinos and Watson (1998). Each infusion site corresponds to the location of the tip of the infusion needle. c and d are photomicrographs showing a representative location/diffusion of fluorescent MSCI in the dHip (bottom; 544 nm excitation); b is the control (PBS). White lines in b–d delineate the limits of the corpus callosum (cc), the cingulum (cg), regions CA1, CA2, and CA3 of the Ammon's horn, and the gyrus dentatus (DG). Notice the absence of fluorescence after PBS infusion (b) and the larger diffusion radius after 0.70 nmol (d) compared with 0.26 nmol (c) MSCI infusions; it is likely that the diffusion area of the fluorescent MSCI underestimates the inactivation area obtained with the MSCI used for the behavioral tests.

