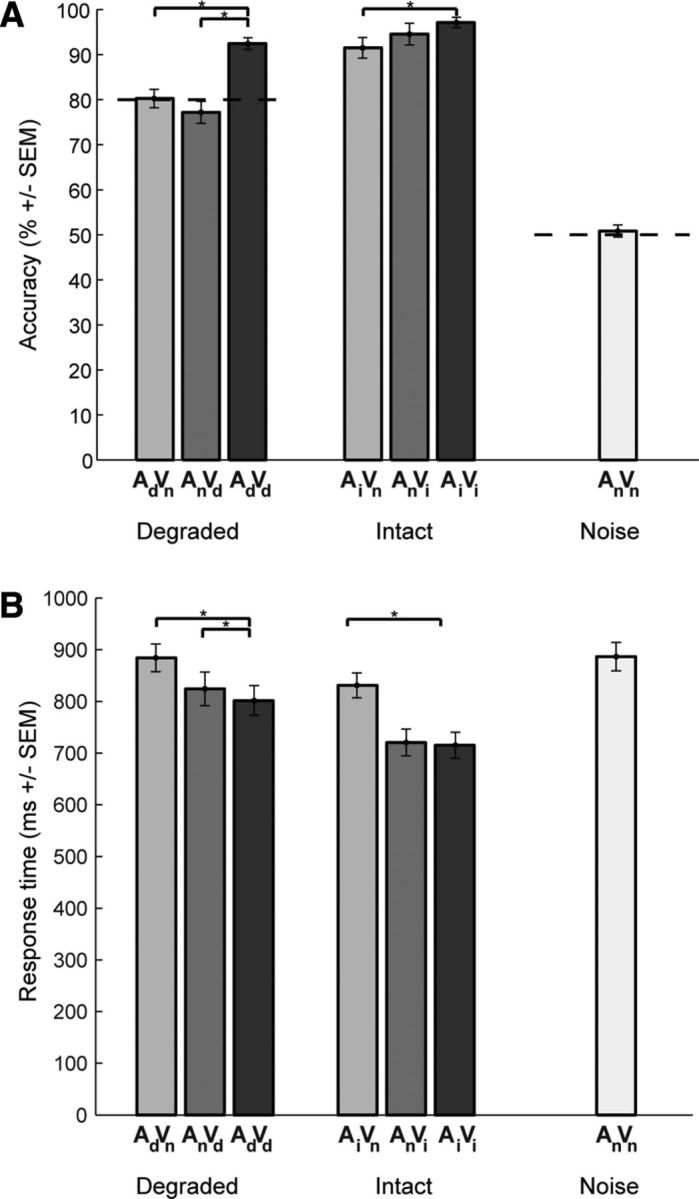
Figure 2.

Behavioral results. Accuracy and response times for motion discrimination are presented as bar plots for degraded, intact, and noise conditions. A, Discrimination accuracy as across-subjects mean (% correct) ± SEM. Dotted lines indicate 80% threshold in degraded conditions and 50% chance level in noise condition. B, Response times as across-subjects mean (ms) ± SEM.
