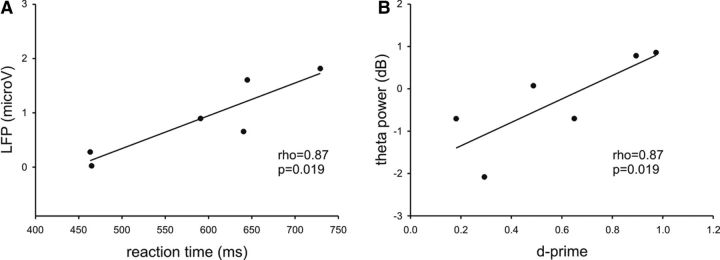
Figure 4.
Relationship between signal changes and behavior. A, At R2, there was a significant correlation between LFPs (100–500 ms, y-axis) and reaction time to targets (x-axis). LFPs represent absolute values. B, At R2, there was a positive correlation between changes in θ power in response to novel items (y-axis) and subsequent recognition performance (D-prime, x-axis).

