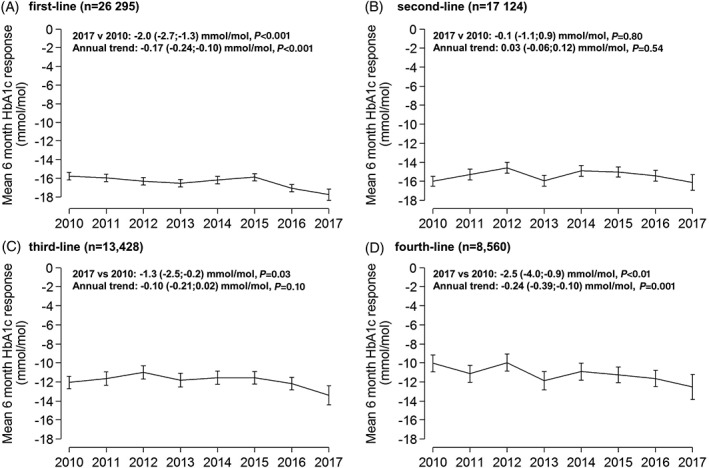
Figure 2.

Mean glycated haemoglobin (HbA1c) response at 6 months, 2010‐2017, for A, first‐line, B, second‐line, C, third‐line and D, fourth‐line therapy. Error bars are 95% confidence intervals. Data are standardized to the average baseline HbA1c, age at diagnosis and duration of diabetes, specific to each drug line in 2017
