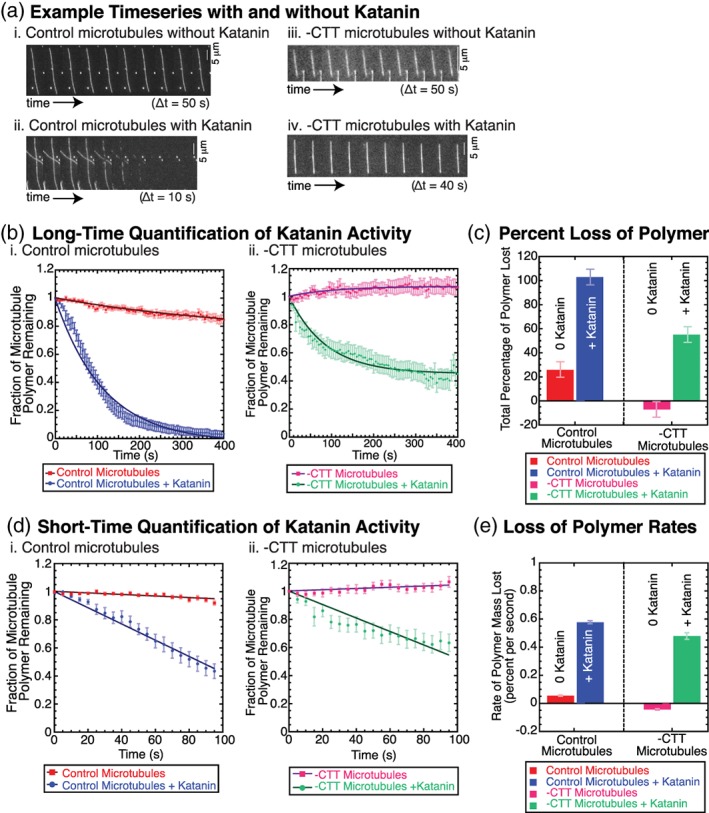
Figure 1.

Katanin activity (250 nM) on microtubules results in polymer loss of taxol‐stabilized microtubules with or without the CTT. (a) Example timeseries (i) for control microtubules without katanin (time between frames 50 s), (ii) for control microtubules with katanin (time between frames 10 s), (iii) for ‐CTT microtubules without katanin (time between frames 50 s), and (iv) for ‐CTT microtubules with katanin (time between frames 40 s). Scale bars 5 μm. All microtubules were taxol stabilized, and a single preparation of katanin was used. (b) Long time data: Total loss of polymer over 400 s for (i) control microtubules without katanin (red squares, N = 43 microtubules in six chambers) and with katanin (blue circles, N = 35 microtubules in seven chambers), (ii) for ‐CTT microtubules without katanin (magenta squares, N = 33 microtubules in four chambers) and with katanin (green circles, N = 32 microtubules in six chambers). Data fit (lines through data sets) to Equation (1). Error bars represent standard error of the mean for average over N microtubules. (c) The percent of polymer lost from microtubules plotted for control microtubules without katanin (red bar), and control microtubules with katanin (blue bar), ‐CTT microtubules without katanin (magenta bar), and ‐CTT microtubules with katanin (green bar). Error bars represent the minimum uncertainty of the measurement, 7%. (d) Short time data: Total loss of polymer over the first 100 s for (i) control microtubules without katanin (red squares, N = 43, six chambers) and with katanin (blue circles, N = 35 microtubules in seven chambers), and (ii) ‐CTT microtubules without katanin (magenta squares, N = 33 microtubules in four chambers) and with katanin (green circles, N = 32 microtubules in six chambers). Data fit (lines through data sets) to Equation (2). Error bars represent standard error of the mean over N microtubules. (e) The rate of polymer loss from Equation (2) fits plotted for control microtubules without katanin (red bar), and control microtubules with katanin (blue bar), ‐CTT microtubules without katanin (magenta bar), and ‐CTT microtubules with katanin (green bar). Error bars represent the error in the rate parameter from Equation (2). All fit parameters are reported in Tables S1–S4. CTT, C‐terminal tail [Color figure can be viewed at wileyonlinelibrary.com]
