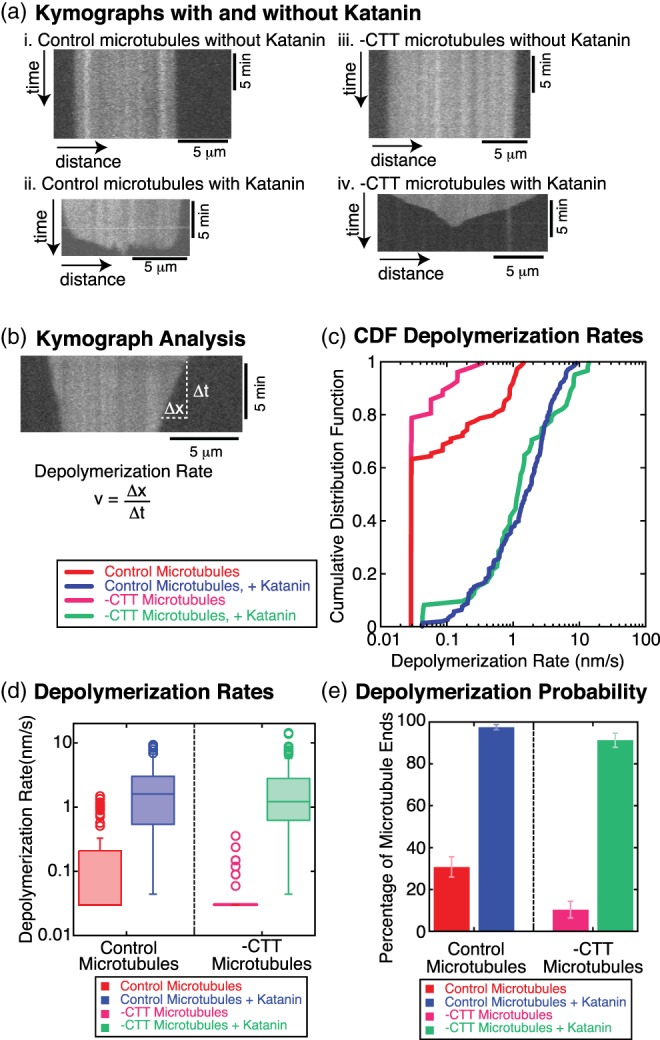
Figure 2.

Filament depolymerization depends on the presence of katanin (250 nM). (a) Example kymographs (i) for control microtubules without katanin, (ii) for control microtubules with katanin, (iii) for ‐CTT microtubules without katanin, and (iv) for ‐CTT microtubules with katanin. All microtubules were taxol stabilized. Vertical scale bars 5 min. Horizontal scale bars 5 μm. (b) Example depolymerization rate measurement method using kymograph. The linear loss of polymer from the microtubule end is measured in the x‐direction displacement, Δx. The amount of time it takes to lose the polymer is measured in the y‐direction displacement, Δt. The depolymerization rate is given by v = Δx/Δt. Vertical scale bar 5 min. Horizontal scale bar 5 μm. (c) Cumulative distribution plots of the depolymerization rates for control microtubules without katanin (red line, N = 91 microtubule ends, 43 microtubules, six chambers), control microtubules with katanin (blue line, N = 161 microtubule ends, 32 microtubules, seven chambers), ‐CTT microtubules without katanin (magenta line, N = 58 microtubule ends, 33 microtubules, four chambers), and ‐CTT microtubules with katanin (green line, N = 69 microtubules ends, 43 microtubules, six chambers). (d) Box‐whisker plots for control microtubules without katanin (red box), control microtubules with katanin (blue box), ‐CTT microtubules without katanin (magenta box), and ‐CTT microtubules with katanin (green box). On box plots, middle lines of the boxes represent the median and the top and the bottom represent the third and first quartiles, respectively. Open circles represent outlier data. (e)The percentage of filaments that displayed a non‐zero depolymerization rate for control microtubules without katanin (red bar), control microtubules with katanin (blue bar), ‐CTT microtubules without katanin (magenta bar), and ‐CTT microtubules with katanin (green bar). Error bars represent the standard error of proportion. CTT, C‐terminal tail [Color figure can be viewed at wileyonlinelibrary.com]
