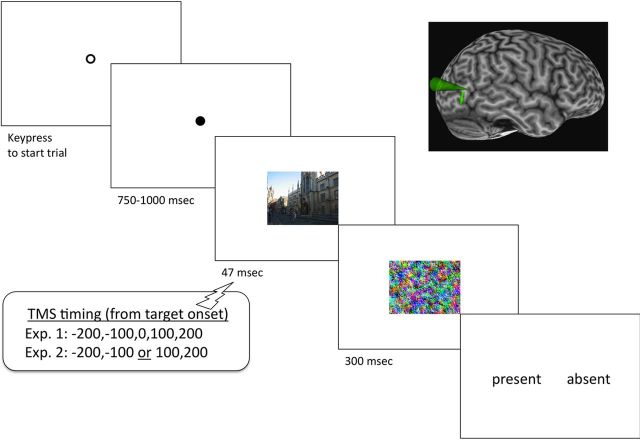
Figure 2.
Diagram of experimental protocol from Experiments 1 and 2. Either TMS was delivered to right hemisphere EBA (functionally localized in each individual), or sham stimulation was applied. Figure elements are not to scale. Inset figure illustrates typical anatomical location of EBA in a screen capture from Brainsight stereotactic localization software. The small arrow reflects the estimated trajectory of the TMS coil.

