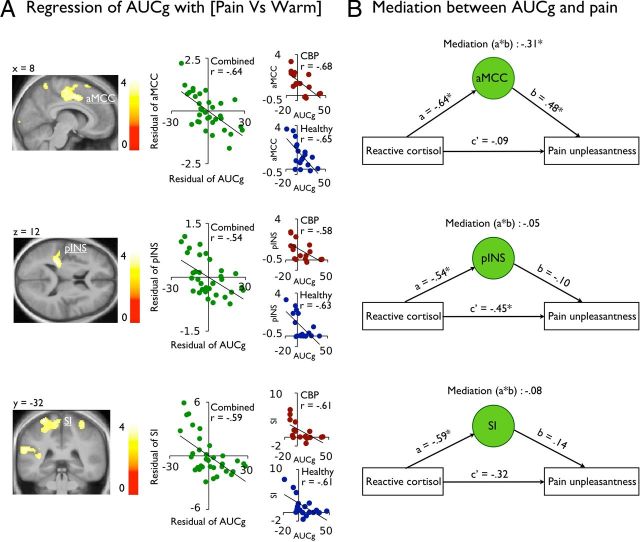
Figure 5.
A, The AUCg of the reactive cortisol response negatively correlated with the BOLD signal response in the aMCC, the S1, and the pINS. The scatter plot (green) represents the residual of the mean parameter estimates (a.u.) in the each of these regions against the residual AUCg of the reactive cortisol. Additional scatter plots represent the relation between AUCg and brain activity for the CBP patients (red) and healthy individuals (blue) separately. Functional data are shown over the mean structural image of all participants (displayed at p < 0.001 uncorrected). B, Bootstrap analyses shows that the aMCC, but not S1 or the pINS, mediated the inverse relation between the reactive cortisol and the pain unpleasantness; *p < 0.05.

