
Figure 2.
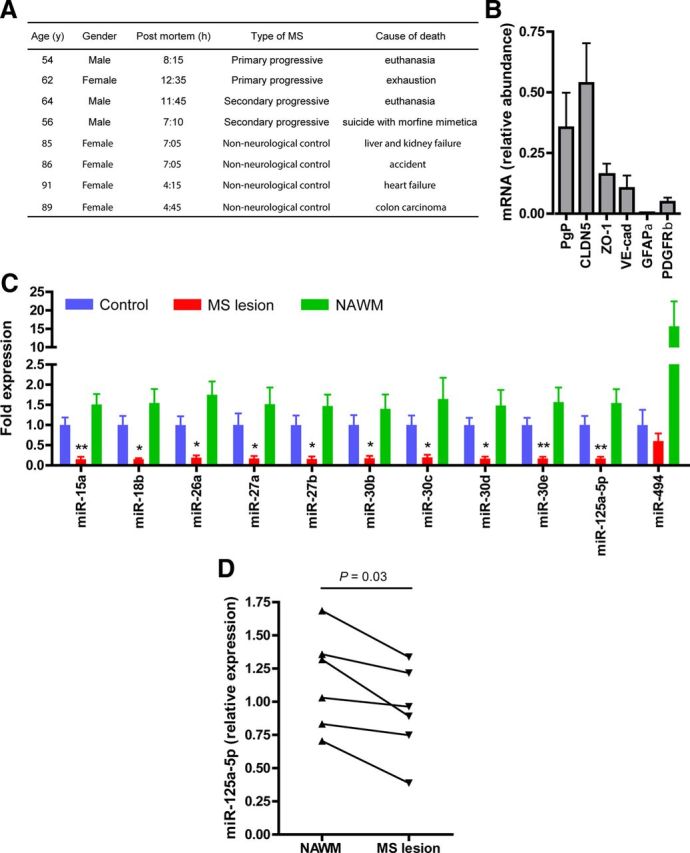
Brain endothelial microRNAs are deregulated in MS patients. A, MS and non-neurological control patient characteristics. B, Capillaries isolated from normal-appearing white matter were characterized for expression of brain endothelial cell markers zona occludens-1, claudin-5, VE-cadherin, and P-glycoprotein; the pericytes marker platelet-derived growth factor receptor-β; and astrocyte marker GFAP at the mRNA level by qPCR analysis. Data show the relative abundance of the indicated mRNA normalized to GAPDH ± SEM. C, qPCR analysis of microRNAs in brain capillaries isolated from brains of non-neurological controls (blue), MS patient normal-appearing white matter (NAWM, green), and MS lesions (red). Data show the mean fold expression relative to control tissue ± SEM, n = 4, *p < 0.05, **p < 0.005 by Student's t test. D, qPCR analysis of miR-125a-5p in brain endothelial cells isolated by laser capture microdissection from NAWM and MS lesions in six individuals. Data show the relative abundance of miR-125a-5p normalized to the small nuclear RNA U6. p = 0.03 by paired Student's t test.