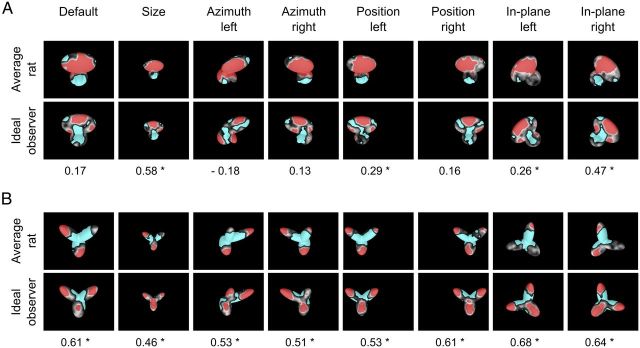
Figure 10.
Critical features' patterns obtained for the average rat and a simulated ideal observer. Rat group average saliency maps, with highlighted significantly salient (red) and antisalient (cyan) features (A, B, top rows), are compared with the saliency maps obtained for a linear ideal observer (A, B, bottom rows). For each object view, the Pearson correlation coefficient between the saliency maps obtained for the average rat and the ideal observer is reported below the corresponding maps. *p < 0.05, significant correlation (permutation test).

