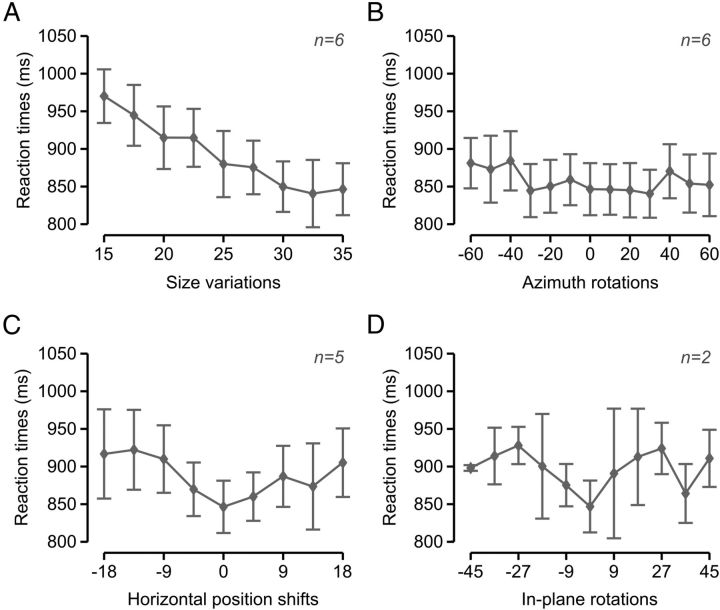
Figure 5.
RTs along the variation axes. Rat group average RTs over the four variation axes along which the objects were transformed. RTs were measured across all the sessions performed by each rat during experimental Phase II (see Materials and Methods) and then averaged across rats. Error bars indicate SEM. Panels A–D refer to size variations (A), azimuth rotations (B), horizontal position shifts (C), and in-plane rotations (D).

