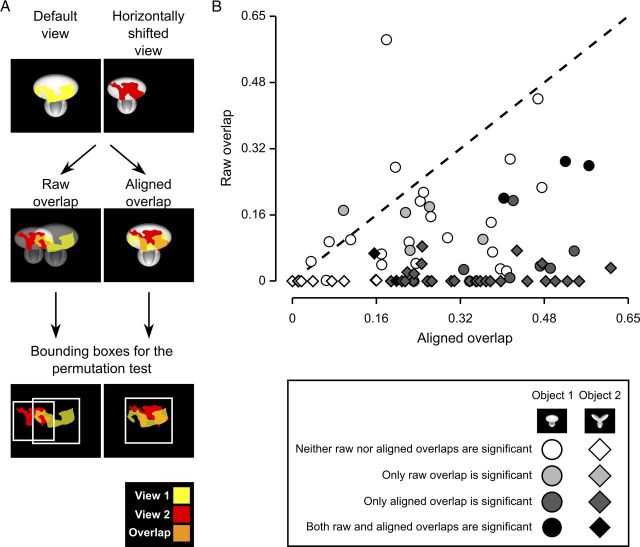
Figure 8.
Raw versus aligned features' overlap for all pairs of object views. A, Illustration of the procedure to compute the raw and aligned overlap between the salient features' patterns obtained for two different views of an object. The default and the leftward horizontally shifted views of Object 1 are used as examples (first row). To compute the raw features' overlap, these two object views (and the corresponding features' patterns) were simply superimposed (second row, left plot), as previously done in Figure 7. To compute the aligned features' overlap, the transformation that produced the leftward horizontally shifted view was reversed. That is, the object was shifted to the right of 18° and scaled back to 35°, so to perfectly overlap with the default view of the object itself (second row, right plot). In both cases, the overlap was computed as the ratio between the orange area and the sum of the red, yellow, and orange areas. The significance of the overlap was assessed by randomly shifting the salient regions of each object view within the minimum bounding box enclosing each view (see Results). Such bounding boxes are shown as white frames in the third row of the figure, for both the raw and aligned views. B, The raw features' overlap is plotted against the aligned features' overlap for each pair of views of Object 1 (circles) and Object 2 (diamonds) resulting from affine transformations (i.e., position/size changes and in-plane rotations). The shades of gray indicate whether the raw or/and the aligned overlap values were significantly larger than expected by chance (p < 0.05).

