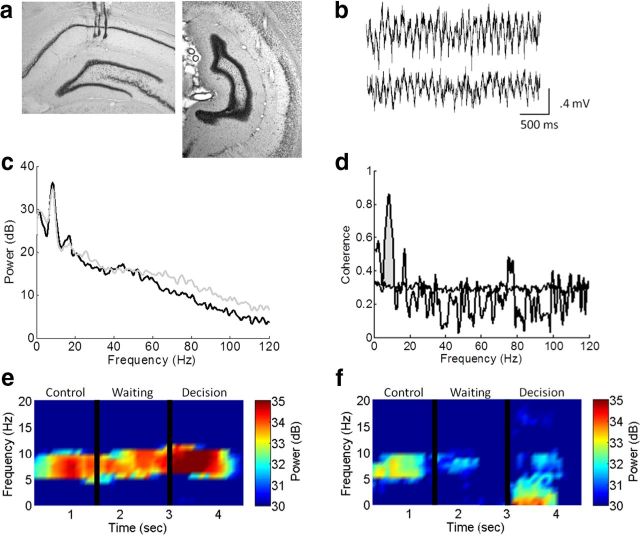
Figure 3.
a, Example placements of dHipp (left) and vHipp (right) electrodes. b, Example trace of dHipp (top) and vHipp (bottom) raw signal. c, Power spectrum density of dHipp (black) and vHipp (gray) electrodes. d, Coherence spectrum between dHipp and vHipp electrodes. Normalized coherence was calculated as more than the 95% of shuffled signals (horizontal line; see Materials and Methods). e, f, Examples of power spectrogram of dHipp (e) and vHipp (f) segmented into the control, waiting, and decision epochs.

