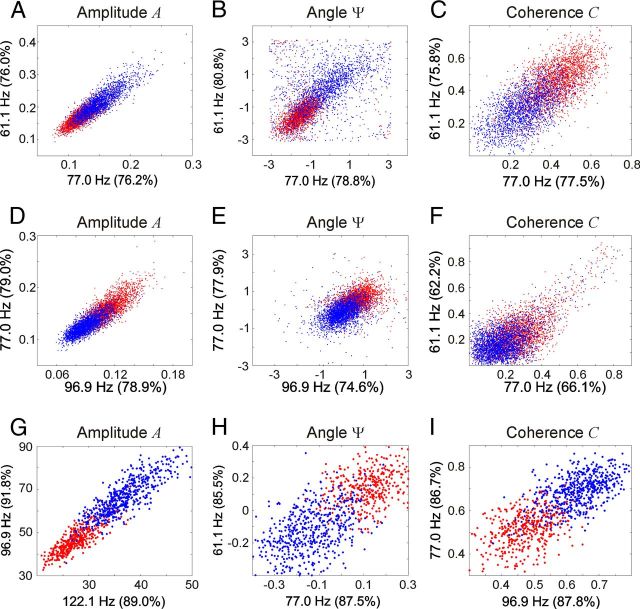
Figure 7.
Discriminability of the attentional condition based on data from single frequency bands. The graphs represent the data clouds for the two attentional conditions (in red and blue). The rows represent dataset FarF (A–C), dataset FarM (D–F), and dataset CloseF (G–I). The columns represent the features spectral amplitude A (A,D,G), phase difference Ψ (B,E,H), and phase coherence C (C,F,I). Each dot represents one trial. For the scatter plots, the two most informative frequency bands of the best electrode (or electrode pair) for the corresponding feature were selected. Classification performance for each frequency is indicated in the corresponding axis label. All data were taken from the period TF.

