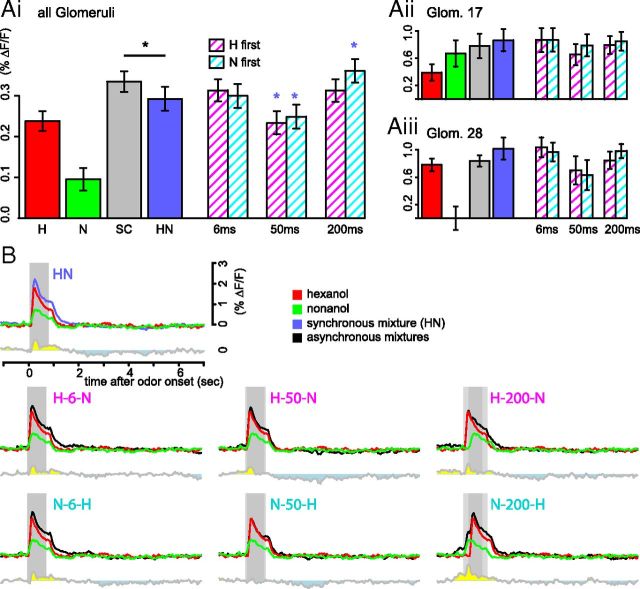
Figure 3.
Asynchronous mixtures induce more inhibitory interactions than synchronous mixtures. Ai, Average PN response strengths during the 4 s after stimulus onset pooled over all measured glomeruli (bars show mean ± SEM, n = 203 glomeruli, 14 bees). The gray bars show the average response strengths to the stronger component, which corresponds to the minimum expected response strength to the mixture in the absence of mixture interaction. Repeated-measures ANOVA revealed significant differences between mixtures (F(6,202) = 7.43, p = 7.8 * 10−8). Blue asterisks denote significant differences from the synchronous mixture (Holm-Sidak post hoc test, global p < 0.05). Aii, Same analysis as in Ai, performed over glomeruli T1–T17, n = 11. Aiii, Same analysis as in Ai, performed over glomeruli T1–T28, n = 10. B, Average response traces of 203 glomeruli to the synchronous mixture (blue), the asynchronous mixtures (black), and their components hexanol (red) and octanol (green). Component traces were shifted according to their delay in the mixture. Bottom gray traces are the averaged, time-resolved difference between the mixture and the stronger component calculated on the level of subjects and then averaged. Times at which the response to the mixture is higher are marked yellow, times at which the response to the stronger component is higher are marked blue (indicating inhibitory mixture interaction).

