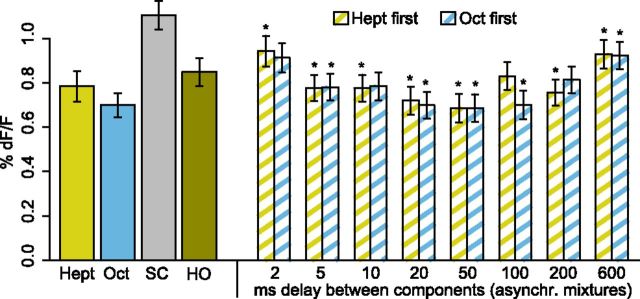
Figure 4.
Inhibitory mixture interactions are strongest at 50 ms asynchrony. Average response strengths (± SEM) of 171 glomeruli (different subjects as for H and N) during 4 s after stimulus onset to 2-heptanone (Hept), 1-octanol (Oct), and the synchronous (HO) and asynchronous mixtures. The gray bar shows the average response strengths to the stronger component. Repeated-measures ANOVA revealed significant differences between mixtures (F(16,170) = 13.172, p < 10−15). Asterisks denote significant difference of asynchronous mixtures to synchronous mixture. All mixtures were significantly lower than the stronger component (not indicated, Holm-Sidak post hoc test, global p < 0.05, corrected for multiple testing).

