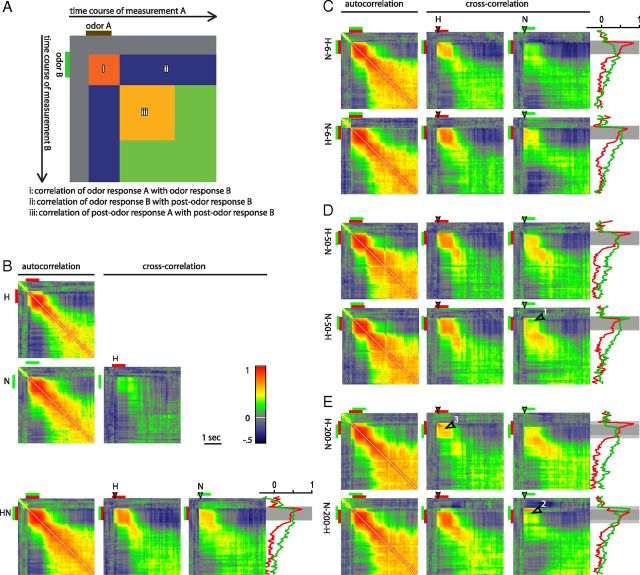
Figure 5.
Cross-correlation matrices of glomerular response patterns of two stimuli. Every pixel gives a correlation value of two glomerular response patterns (vectors of length 203) for a certain time lag between two stimuli. A, Schematic of the cross-correlation between an odor A and an odor B explaining the meaning of the components in each cross-correlation image. B, Auto- and cross-correlation of the components and the synchronous mixture. N (green) indicates nonanol; H (red), hexanol. Time traces of the correlation values in the vertical line indicated by the filled arrowheads are shown at the side. Red indicates the correlation between the initial hexanol response and the mixture response; green, correlation between the initial nonanol response and the mixture response. C–E, Autocorrelation and cross-correlation of the components and the asynchronous mixtures. Numbered arrowheads refer to effects described in the text.

